Image Processing Reference
In-Depth Information
(a)
(b)
(c)
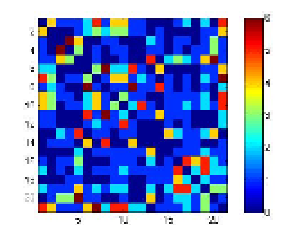
Fig. 15. Community of the user "129" (shown by pink color at Fig.12): averaged (scaled by 5)
pair-wise correlations between oscillators at
t
=
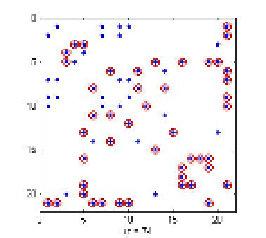
10 (a). Intra-community adjacency matrix
(red circles) and links predicted by dynamics (blue dots) at different resolution levels:
t
=
15
=
(b) and
t
25 (c).
the threshold
η
for the dynamical connectivity matrix
C
t
(
η
)
(which is linked to time
resolution
t
) we obtain different connectivity matrices
C
η
(
t
)
presenting the network evolution.
η
=
=
η
=
=
Connectivity matrices (blue points) corresponding to
25) are
shown at Fig.15(b) and Fig.15(c), respectively. The community adjacency matrix is marked
on the same figures by red circles. As one can see, dynamical systems first reliably detect
the underlaying topology and then form new links as the result of local interactions and
dynamical links update. It can be easily verified that practically all new links (e.g., 12 out of 13
at Fig.15(b)) create new cliques, hence we can interpret these new links as the Friend-of-Friend
recommendations.
Calculated
3(
t
15) and
2.3 (
t
scores
S
(
i
,
i
)
DC
(
)
for dynamical systems together with the Friend-of-Friend
intra-community recommendations for two predictors based on the soft community detection
(Katz predictor and convergence speed to consensus,
S
(
i
,
i
)
k
,
n
CC
(
)
) are summarized in Table 2.
Here we list all new links together with their normalized prediction scores for the user "129"
which create at least one new clique within its community (shown by pink color at Fig.12).
k
,
n
destination
S
(
i
,
i
)
S
(
i
,
i
)
S
(
i
,
i
)
KC
(
)
CC
(
)
DC
(
)
source
s
,
d
,%
s
,
d
,%
s
,
d
,%
129
51
10.5
22.6
18.6
129
78
11.1
16.3
20.8
129
91
47.1
15.4
11.6
129
70
11.3
15.3
18.9
129
92
9.6
15.3
18.8
129
37
10.5
15.1
11.4
Table 2. Scores for the FoF intra-community recommendations for user 129 according to
different similarity measures for the phone-calls network at Fig.12.
Recall that both
S
(
i
,
i
)
and
S
(
i
,
i
)
CC
(
)
DC
(
)
are based on the network synchronization with
closely related Laplacians. As the result, the distribution of prediction scores
S
(
i
,
i
)
k
,
n
k
,
n
CC
(
k
,
n
)
and
S
(
i
,
i
)
DC
(
)
are rather close to each other, compared to the the distribution of the routing-based
Katz score
S
(
i
,
i
)
k
,
n
. Convergence of opinions to a consensus within communities in many
cases is the important target in social science.
KC
(
k
,
n
)
As an example, the best intra-community