Image Processing Reference
In-Depth Information
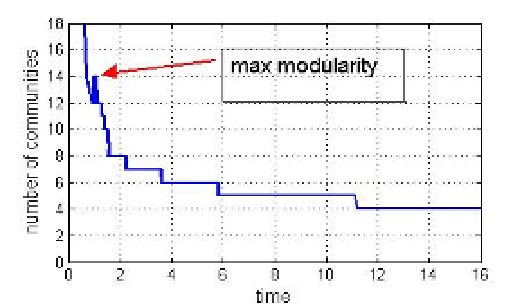
Fig. 11. Stability of communities at different resolution levels.
stable partitions appear at the higher hierarchical levels starting from 8 communities. In the
following we rely on this fact to build the ground truth references for evaluation of clustering.
7.2 Applications for multi-layer graphs
Besides phone and SMS call-logs, the social affinity of participants may also be derived from
other information layers, such as a local proximity of users (BT and WLAN layers) and their
location information (GPS). In this case the soft communities detection may be extended to
include multiple graph layers. In particular, we found that users' profiles may significantly
vary across the layers. For example, a user may have dense BT connections with a multiple
communities participation, while his phone call activities may be rather limited. Combining
information from several graph layers can be used to improve the reliability of classification.
Below we show some preliminary results, more detailed analysis of multi-layer graphs built
from mobile datasets may be found in (Dong et al, 2011).
To make verification of detected communities we select a subset of 136 users with known
email affiliations as the ground truth. In our case these users are allocated into 8 groups. To
get the same number of communities in social affinity multi-layer graphs, we use the random
walk (11) to obtain the more course resolution than provided by the modularity maximization.
Fig 12 depicts communities (color coded) derived from the phone-calls graph. Single nodes
here indicate users which did not make phone calls to other participants of the data collection
campaign. Communities derived from the BT-proximity graph and mapped on the phone-call
graph are shown at Fig.13. As expected, multi-layers graphs help us to classify users based
on the additional information found in other layers. For example, users which can not be
classified based on phone calls (Fig.12) are assigned to communities based on the BT proximity
(Fig.13). Fig.14 shows communities detected in the combined graph formed by the BT and
phone-call networks and then mapped on the phone-call network.
Next, we consider communities detected at single and combined layers with different
strategies (35)-(37) described in Section 5 and compare them to the ground truth. To evaluate
accuracy of community detection we use the normalized mutual information (NMI) score,
purity test and Rand index (RI) (Manning et al, 2008). We found that the best graph combining
is provided by weighted superposition (37) according to the
max
-modularity of layers
Q
.
Results of the comparison are summarized in Table 1. As expected, different graph layers have
a different relevance to the email affiliations and do not have fully overlapped community
structures. In particular, the local proximity seems to be more relevant to professional relations