Image Processing Reference
In-Depth Information
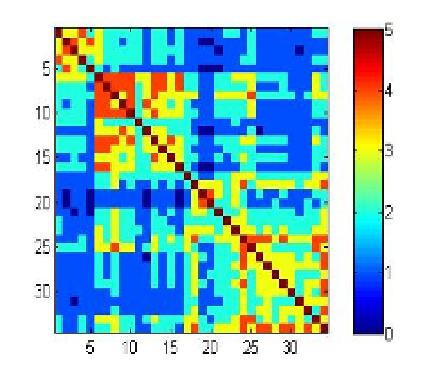
(a)
(b)
=
Fig. 6. Karate club: averaged pair-wise correlations (scaled by 5) between oscillators at
t
1
re-ordered according to communities. Coupling scenarios: (a) attractive-repulsive
B.2
;(b)
attractive-neutral
B.3
.
bluetooth (BT) and WLAN proximity, GPS coordinates, information on mobile and
applications usage and etc) are collected from about 200 participants for the period from
June 2009 till October 2010. Besides the collected data, several surveys before and after the
campaign have been conducted to profile participants and to form a basis for the ground truth.
In this section we consider social affinity graphs constructed from call-logs, GPS locations and
users proximity.
Fig.10 shows a weighted aggregated graph of voice-calls and SMS connections derived from
corresponding datasets. This graph depicts connections among 136 users, which indicates
that about 73% of participants are socially connected within the data collection campaign.
To find communities in this network we first run the modularity maximization algorithm,
which identifies 14 communities after the 3d iteration (Fig.10). To get the higher hierarchical
levels one could represent each community by a single node and continue clustering with
the new aggregated network. However, this procedure would result in a loss of underlaying
structure. In particular, the hierarchical community detection with the nested communities
structure poses additional constrains on the maximization process and may lead to incorrect
classification at the higher layers. For example, after the 3d iteration the node "v146",
shown by red arrow at Fig.10, belongs (correctly) to a community shown by white circles
(3 intra-community edges and single edges to other 6 communities). After agglomeration, the
node "v146" will be assigned to the community shown by white circles on the left side of the
graph. However, it is easy to verify that when communities on the right are merged, the node
"v146" is to be re-assigned to the community on the right side of the network. Dynamical
formulation of modularity extended with the random walk allows different (not necessarily
nested) allocations of nodes at different granularity (resolution) levels and helps to resolve
this problem.
Fig.11 presents a number of communities at different hierarchical levels detected by the
random walk for the network shown at Fig.10. As one can see, the
max
-modularity partition
with 14 communities is clearly unstable and hardly could be used for reliable predictions, the