Image Processing Reference
In-Depth Information
components
blood
noise
clutter
power
-6dB
-20dB
0dB
frequency
0.24*
fs
(white noise)
-0.08*
fs
Table 8. Components of simulation input model
4.5.2 Implementation
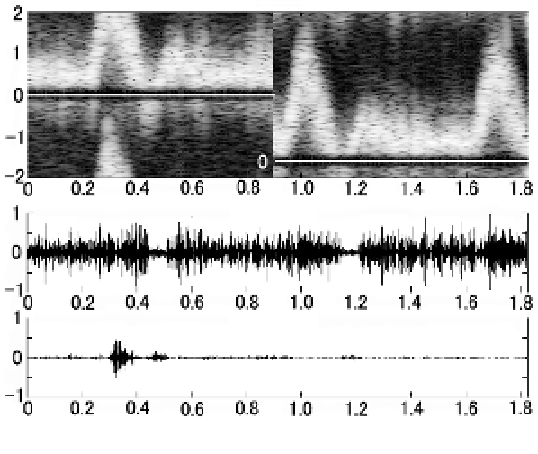
On the basis of the Doppler IQ-signal of the carotid artery collected with the actual Doppler
ultrasound system, an example of anti-aliasing signal processing of the Doppler audio is
shown in Fig. 22. We use a string phantom (Mark 4 Doppler Phantom: JJ&A Instrument
Company) and the ultrasonic diagnosis equipment (SSA-770A: Toshiba Medical Systems
Corporation) for generating and collecting the Doppler signal. We use PLT-604AT (6.0 MHz
linear probe) at PRF=4 kHz equivalent to
fs
. We collect the IQ-data in PWD mode.
Moreover, we set cut-off frequency at an HPF of 200 Hz for clutter removal. The output
waveforms of both sides of the Doppler audio and spectrum image obtained from the IQ-
data are shown in Fig. 22. In this figure, in the vicinity of 0.9 s, the baseline-shift is switched
into -0.4*
fs
from 0. At the zero baseline-shift, we observe aliasing in the spectrum image
shown in Fig. 22(a) and a negative-side output in Fig. 22(c). However, we confirm that the
positive-side display range of the spectrum image expands after a baseline-shift and is
interlocked with the Doppler audio. Although it is not observed in Fig. 22, the characteristic
of the band-pass filter changes immediately after a baseline-shift. We will continue to
examine the transient response of the Doppler audio under this effect and to consider
implementation technologies, such as muting.
Frequency (kHz)
Time (s)
(a) spectrum image
Amplitude (V)
Time (s)
(b) forward output
Amplitude (V)
Time (s)
(c) reverse output
Fig. 22. Doppler spectrum display and audio output waveform
4.6 Conclusion
We developed the direction separation system of a Doppler audio interlocked with the anti-
aliasing processing of a spectrum image using a complex IIR band-pass filter system.