Image Processing Reference
In-Depth Information
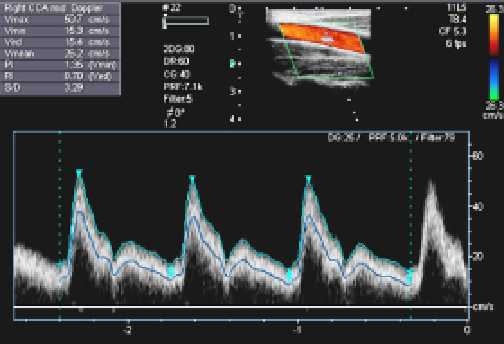
Fig. 1. Example of ultrasound diagnostic image of a carotid artery
Except for Doppler signal processing, as another method of blood-flow or tissue velocity
detection, the cross-correlation method using the signal before quadrature-detection
processing (
R (t)
in Fig. 2(a)) has been also reported. However, the base-band signal (
L (t)
in
Fig. 2(a)) processing after quadrature-detection is the present mainstream, because of its
narrow bandwidth and little processing load. All the direction separation systems examined
this time are the IQ-signal processing after quadrature-detection. The received signal
R(t)
in
a range gate is denoted by a formula (1). Here, a reflective echo signal is assumed to be the
amplitude
A
, Doppler shift angle-frequency
, and phase
.
i
Rt
()
A
exp
j
t
j
(1)
i
p
i
i
The mixer output
M(t)
is denoted by a formula (2). Reference angle-frequency of a mixer is
set to
(same as probe Tx angle-frequency) here.
Mt
()
Rt
() exp
j
t
p
(2)
i
i
1
1
A
exp
j
2
t
j
A
exp
j
t
j
i
p
i
i
i
i
i
2
2
The LPF output
L(t),
high frequency component is removed is denoted by a formula (3).
i
1
Lt
()
A
exp
j
t
j
(3)
i
i
i
2
In Fig. 2(a) (R1), (R2), and (R3) show the position of the blood-vessel-wall upper part, the
inside of a blood vessel, and the blood-vessel-wall lower part, respectively. Fig. 2(b) shows
typical spectra of quadrature-detection output
L(t),
when a range gate is set in each position.
A vertical axis shows power and the horizontal axis shows frequency, respectively. Since the
sampling is interlocked with PRF of transmission, the vertical axis has a frequency range of
/2
fs
.
L(t)
is mainly constituted from the low frequency component caused by the clatter
(strong echo from tissue) and middle to high frequency component caused by weak blood-