Image Processing Reference
In-Depth Information
(a)
(b)
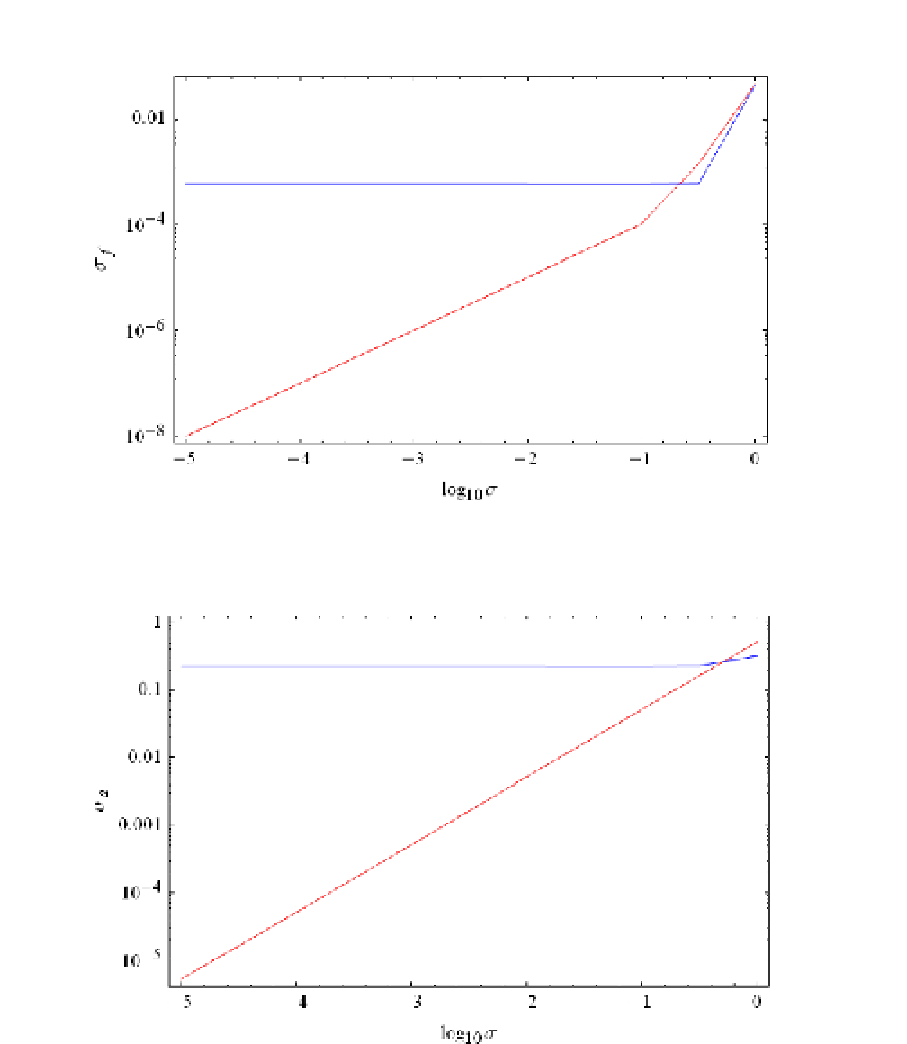
Fig. 12. Frequency and amplitude errors,
f
and
a
, as a function of the noise standard
deviation for OMP (blue) and OMP-NLS (red) for a signal composed of a two sinusoids
with
N
= 128,
M
= 20 and
N
f
= 4 averaged over 100 trials with randomly chosen input
frequencies. (a) Frequency error. (b) Amplitude error.