Image Processing Reference
In-Depth Information
(b)
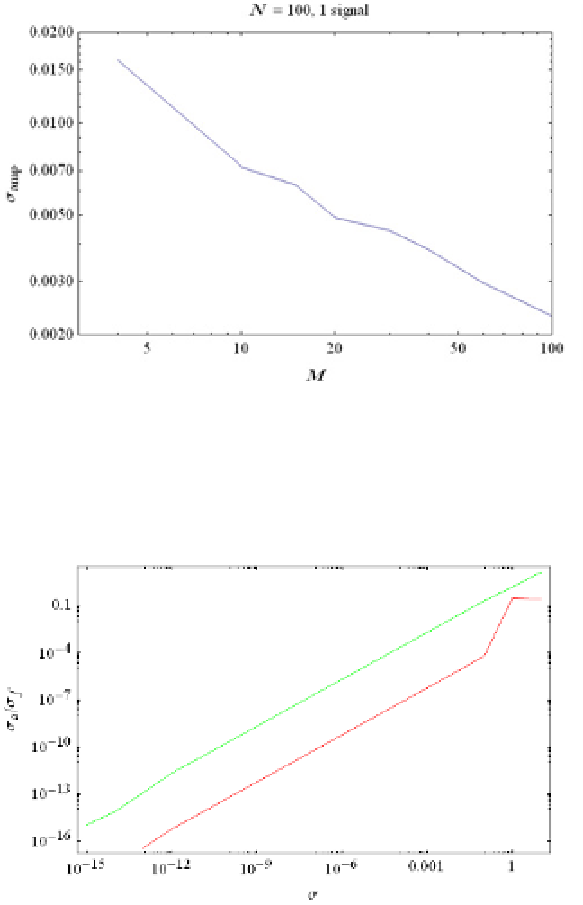
Fig. 7. Standard deviation of the errors in frequency and amplitude of sinusoids mixed by a
mixing matrix with dimensions
M
x 1024 recovered using OMP/NLS as a function of the
small dimension
M
of the mixing matrix for = 10
-2
. The results are obtained from the
average of 100 independent calculations. (a) Frequency, (b) amplitude error.
Fig. 8. Standard deviation of the frequency and amplitude errors,
f
(lower red curve) and
a
(upper green curve), as a function of averaged over 20 different 4x1024 mixing matrices.
5.2 Signal composed of 2 sinusoids with 100:1 dynamic range
Noise also affects the ability of our algorithm to recover a small signal in the presence of a
large signal. Figs. 9 and 10 show
f
and
a
for a test case in which the amplitudes are given
by {1.0, 0.01},
M
= 10,
N
=1024 and the frequencies are well separated. These results are for a
single realization of the mixing matrix and averaged over 20 realizations of the noise. Note
that as expected, the frequency and amplitude of the large-amplitude component are much
better recovered than those of the small-amplitude component. Knowledge of the
parameters of the small component essentially disappears for greater than about 0.005.
Tests with the small amplitude equal to 0.001 and 0.0001 suggest that this threshold scales
with the amplitude of the small signal.