Image Processing Reference
In-Depth Information
Fig. 15. Low-Pass / High-Pass Lynn's Filter Amplitude Response - Cut Frequency 0.5 Hz
Fig. 16. Low-Pass / High-Pass Lynn's Filter Amplitude Response - Cut Frequency 5 Hz
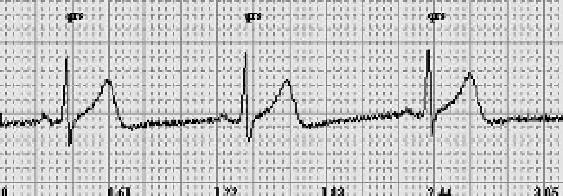
Figures 17, 18, 19, 20 and 21 present signals registered by an implement ECG device using
Figure 4 and 5 circuits (Vidal & Gatica, 2010). Figure 15 shows a pure signal ECG without
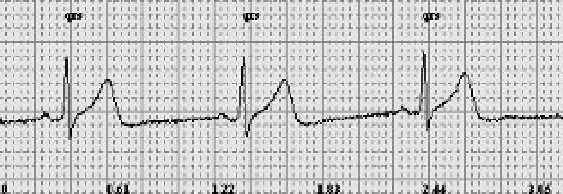
applying filters to delete noise. Figure 18 shows the 35 Hz low-pass Lynn's filter application
on the Figure 17 signal. Figure 18 presents the application of a 48 Hz low-pass filter
application over the Figure 17 signal. In Figures 20 and 21 the application of 0.2 and 0.5
high-pass Lynn's filters respectively on the Figure 17 signal is shown. It is important to be
aware of the group delay effect on the ECG signal after the 0.2 Hz high-pass Lynn's filter
application, 423 samples in this case (around 1 second). Likewise, for the 0.5 Hz high-pass
Lynn's filter application there is a group delay of 160 samples.
Fig. 17. Pure ECG Signal
Fig. 18. Filtered ECG Signal Using Low-Pass 35 Hz Lynn's Filter