Image Processing Reference
In-Depth Information
3.4 Software description
The Measurement Frequency software (MF) of the Multi-Channel Digital Frequency Stability
Analyzer is operated by the LabWindows/CVI applications. MF configures the parameters of
DAQ, stores original data and results of measuring to disk, maintains synchronization of the
data stream, carries out the algorithms of measuring frequency and phase difference, analyzes
frequency stability, retrieves the stored data from disk and prepares plots of original data,
frequency, phase difference, and Allan deviation. Figure 8 shows the main interface. To view
interesting data, user can click corresponding control buttons to show beat signals graph,
frequency values, phase difference and Allan deviation and so on.
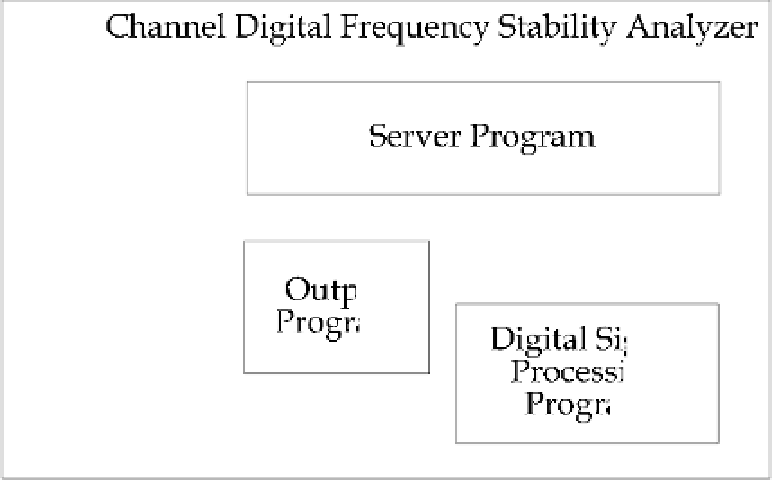
MF consists of four applications, a virtual instrument panel that is the user interface to
control the hardware and the others via DLL, a server program is used to manage data,
processing program, and output program. Figure 7 shows the block diagram of MF
software.
Fig. 7. Block Diagram of the Measurement Frequency Software
The virtual instrument panel have been developed what can be handled friendly by users. It
looks like a real instrument. It consists of options pull-down menu, function buttons, choice
menus. Figure 8 (a) shows the parameters setting child panel. Users can configure a set of
parameters what involve DAQ, such as sampling frequency, amplitude value and time base
of DAQ. Figure 8 (b) shows the screen shot of MF main interface. On the left of Fig. 8 (b),
users can assign any measurement channel start or pause during measurement. On the right
of Fig. 8 (b), strip chart is used to show the data of user interesting, such as real-time original
data, measured frequency values, phase difference values and Allan deviation. To
distinguish different curves, different coloured curves are used to represent different
channels when every channel name has a specific colour. Figure 8 (c) shows the graph of the
real-time results of frequency measurement when three channels are operated
synchronously, and (d) shows the child panel what covers the original data, frequency
values and Allan deviation information of one of channel.