Image Processing Reference
In-Depth Information
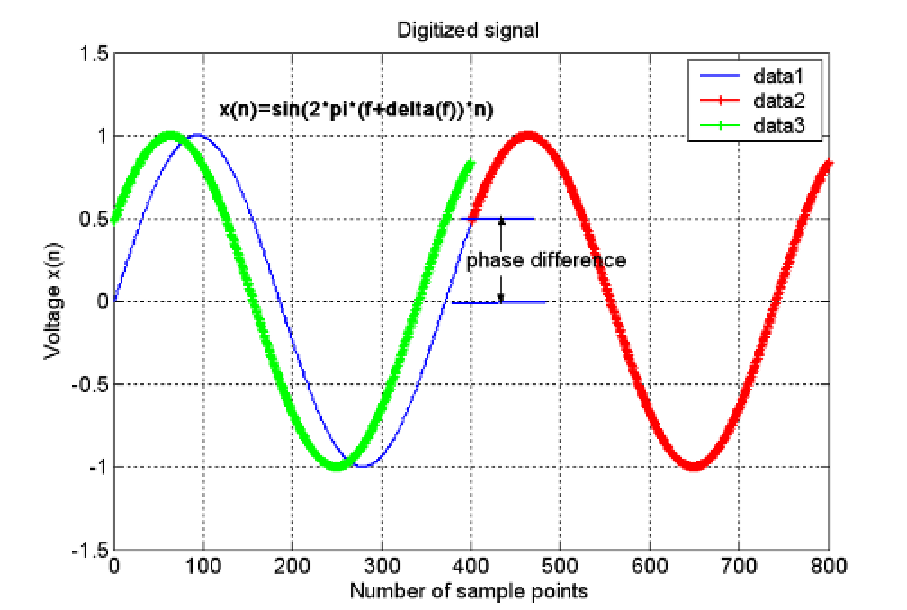
Fig. 5. Signals of 1.08Hz are digitized at the sampling frequency of 400Hz
Where m denotes the delay and m=0, 1, 2…N-1. To calculate the value of
, m is supposed
to be zero. So we can get the formula (3.7):
1
1
R
( )
c s(2(
f
f
))
c s(2))
f
(3.7)
xx
N
12
2
2
From the formula (3.7), the that being mentioned in formula (3.3) means frequency
drift of under test signal during the measurement interval can be acquired. On the other
side, the
f
is measured by using the coarse measurement method. So combining coarse
and fine measurement method, we can get the high-precision frequency of under test
signals.
3.3 Hardware description
The Multi-Channel Digital Frequency Stability Analyzer consists of Multi-channel Beat-
Frequency signal Generator (MBFG) and Digital Signal Processing (DSP) module. The multi-
channel means seven test channels and one calibration channel with same physical
structure. The system block diagram is shown in figure 6.
The MBFG is made up of Offset Generator (OG), Frequency Distribution Amplifier (FDA),
and Mixer. There are eight input signals, and seven signals from under test sources when
the other one is designed as the reference, generally the most reliable source to be chosen as
reference. The reference signal
f
is used to drive the OG. The OG is a special frequency
synthesizer that can generate the frequency at
f
f
. The output of OG drives FDA to
f
r
0
b