Biology Reference
In-Depth Information
aim of offering a complete and organized catalog of information on a
particular subject. Just as an anatomical atlas was supposed to summa-
rize knowledge about the form of the human body, the individual pages
fi lled with protein sequence data formed a map of biological knowl-
edge. For Dayhoff, the distinct sequences were maps of a small part of
the space of biochemical structure, function, and origins; taken together,
they formed a total image, or atlas, of biology. The visual metaphor pro-
vided both a rationale and a set of organizing principles for Dayhoff's
collecting.
If organizing sequences was diffi cult, comparing them was even
harder. In the 1970s, sequence comparison became an exemplary prob-
lem for bioinformatics, since “matching” of sequences provided the
key to understanding evolution, protein function, and, later, whole ge-
nomes.
10
But the comparison of even relatively short sequences was a
tedious task that involved many steps. Many of the methods devised to
attack this problem were based on visual metaphors and insights.
The basic method of comparing two protein sequences was to write
each sequence on a strip of paper and slide the pieces of paper past one
another, one amino acid at a time, to produce different alignments; for
each alignment, the biologist would have to count the number of matches
and mismatches in order to “score” the alignment. The alignment with
the best score (the fewest mismatches) was the best alignment. One al-
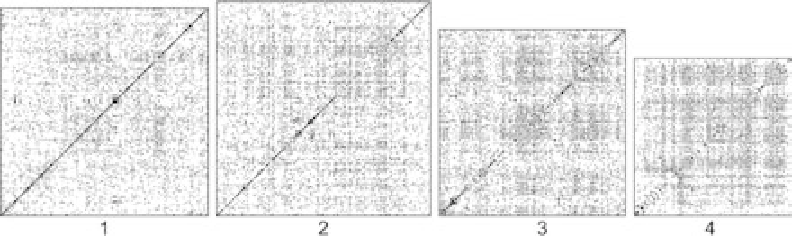
ternative, known as the dot-matrix method, was to write one sequence
across the top of a matrix and the other down the left side; the biolo-
gist then fi lled in the matrix, placing a dot wherever two amino acids
matched. The best alignment could be found simply by inspection: the
longest diagonal line of dots was the best alignment (fi gure 6.1).
11
FIGURE 6.1
The dot matrix method of matching sequences. “Dot plots” are constructed by writing a
sequence from one organism vertically on the left and a sequence from another organism horizontally
across the top. The actual letters of the sequences are not shown in these images. Dots are then placed
where the nucleotide in a column matches the nucleotide in a row. Thick diagonal lines appear where
there are regions of similarity between two sequences. (Wright et al. “A draft annotation.” Reproduced
from
Genome Biology
under the BioMed Central open access license agreement.)