Environmental Engineering Reference
In-Depth Information
0.075
0.070
H+ Pancreas
H+
yroid
0.065
0.060
0.055
0.050
0.045
0.040
0.035
0.030
0.025
100
120
140
160
180
200
Energy (MeV)
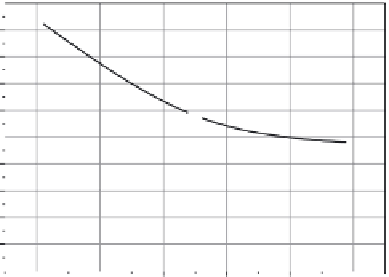
FIGURE 7.2
Ionizations.in.organs
(at.600.nm.depth).
100
Ne+ Pancreas
H+ Pancreas
10
1
0.1
0.01
100
120
140
160
180
200
Energy (MeV)
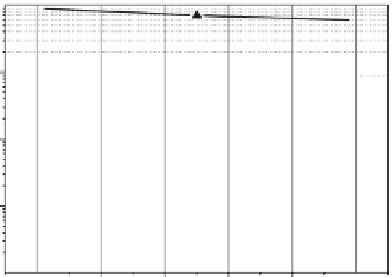
FIGURE 7.3
Ionizations.in.pancreas
(at.600.nm.depth).
two. organs. increases. about. 180%. as. the. energy. is. doubled,. which. is. seen.
in.Figure 7.3..The.neon.ion.has.larger.energy.losses.than.the.proton,.which.
is.related.to.the.higher.dose.in.tumor.depth.for.the.heavier.ion.(Heidelberg.
Ion-Beam.Therapy.Center.2007)..The.energy.losses.decrease.linearly.in.the.
pancreas..Figures 7.4.and.7.5.show.the.energy.recoils..In.the.pancreas,.proton.
energy.loss.increases.while.neon.ion.energy.loss.decreases,.which.is.seen.as.
the.black.color.in.Figures 7.4.and.7.5..The.interesting.thing.is.that.the.energy.
loss. changes. around. 160. MeV. in. each. igure.. This. energy. is. an. important.
point.with.respect.to.clinical.purpose..The.neon.ion.has.the.higher.energy.
recoil..The.temperature.distribution.of.protons.is.shown.for.simulations.of.
the.pancreas..The.trend.is.similar.to.the.energy.to.recoil.and.the.lowest.tem-
perature.is.shown.at.150.MeV.


Search WWH ::

Custom Search