Environmental Engineering Reference
In-Depth Information
C
C
C
C
C
H
H
C
H
H
N
N
H
N
H
H
N
C
N
N
N
N
C
C
C
N
C
H
N
N
H
H
C
C
H
C
C
C
H
C
C
(a)
Ionization
Recoils
Ions
0.07
0.06
0.05
0.04
0.03
0.02
0.01
0
0 A
Target Depth
1.2 um
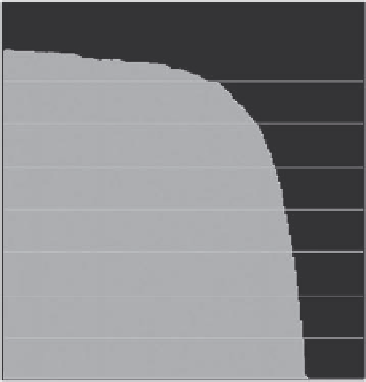
(b)
FIGURE 7.1
(a).H+.injections.into.pancreas.molecular.structure.of.carbon.(C),.hydrogen.(H),.nitrogen.(N),.
oxygen.(unmarked);.and.(b).energy.losses.(H+.100.MeV).in.pancreas.
between.the.highest.and.lowest.values.is.0.075.(eV/Å)..The.energy.to.recoil.
increases.as.the.proton.energy.increases..For.phonons,.the.energy.to.recoil.
decreases.as.the.proton.energy.increases.
The.pancreas.experiences.a.larger.loss.than.the.thyroid,.which.is.shown.
in. Figure 7.2.. In. 100. MeV,. the. difference. is. 0.0075. (eV/Å). and. in. 200. MeV,.
the. difference. is. 0.0210. (eV/Å).. The. difference. in. energy. loss. between. the.

Search WWH ::

Custom Search