Environmental Engineering Reference
In-Depth Information
9.4 Results
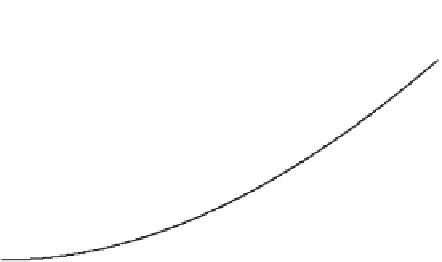
Figure 9.9.includes.ive.graphs.showing.the.simulation.results..Figure 9.9(a).
shows. the. results. for. atomic. nanotechnology,. which. is. calculated. by. the.
summation. of. the. technological. aspect,. manpower. aspect,. and. marketing.
aspect,.where.the.value.increases.with.increasing.slope..Figure 9.9(b).shows.
the.results.for.academic.promotion,.where.the.value. increases.nonlinearly..
Figure 9.9(c). shows. the. results. for. industrial. promotion,. where. the. value.
increases.with.decreasing.slope..Figure 9.9(d).shows.the.results.for.the.license.
400,000
300,000
200,000
100,000
0
2010
2014
2018
2022
2026
2030
2034
2038
2042
2046
2050
Time (Year)
Atomic Nanotechnology (ANT): Graph1
_______________________________
(a)
1,000
750
500
250
0
2010 2014 2018 2022 2026 2030 2034 2038 2042 2046 2050
Time (Year)
Academic Promotion: Graph1
(b)
FIGURE 9.9
Quantiication.of.(a).atomic.nanotechnology,.(b).industrial.promotion,.(c).academic.promotion,.
(d).license,.and.(e).price.


Search WWH ::

Custom Search