Geoscience Reference
In-Depth Information
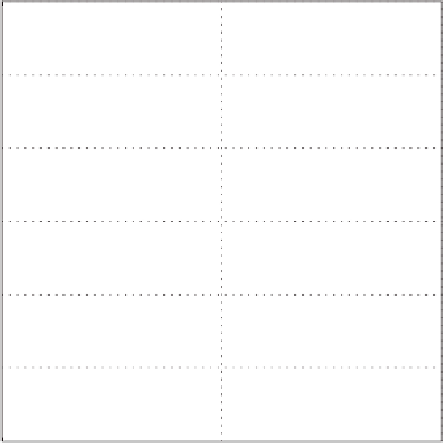
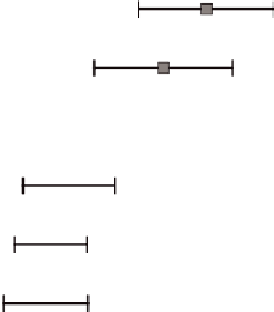
Fig. 5.3
Kinematic stress at five levels during the ISW storm. The error bars represent
+
1std.
deviation of the covariance estimates of kinematic Reynolds stress in each 15-min “realization.”
The dashed line is a log-linear fit of the stress magnitudes as described in the text (Adapted from
McPhee and Martinson 1994. With permission American Association for the Advancement of
Science)
w
T
K
∂
T
∂
z
∼
−
10
−
4
Km
−
1
∼
which, of course,is verysmall. The stated accuracyof the Sea-Bird oceanographic
thermometersusedduringISWwas
0.01
◦
C,consistentwiththesortofvariability
weobservedinIOBLtemperatureusingthefactorycalibrations.However,byiden-
tifyingtimeswhenmeasuredheatfluxwasnearzero,wewereabletoapplyconstant
correctionsto each thermometerthat eliminated any potentialtemperaturegradient
duringthat time. With these correctionsit was then possible to estimate time series
of temperature gradient in the IOBL by linear regression of the adjusted temper-
atures. The vertically averaged heat flux and negative thermal gradient (Fig. 5.4)
are strongly correlated, and provide an estimate of the average thermal diffusivity,
whichis
K
T
±
018m
2
s
−
1
.
The various estimates of discrete and bulk eddy viscosity/diffusivities are sum-
marized in Fig. 5.5. They are generally consistent, and support the hypothesis that
a mixing length derived from the inverse of the wave number at the peak in the
w
spectrummaybeapowerfultoolforunderstandingturbulencescalesinthe IOBL.
=
.
0