Geoscience Reference
In-Depth Information
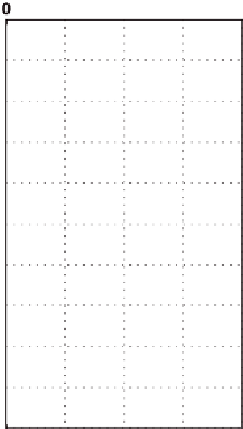
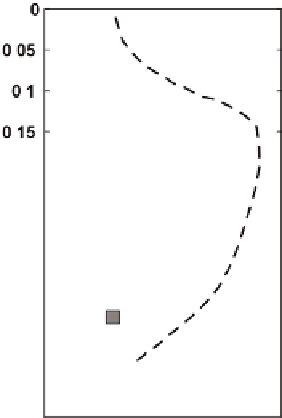
Fig. 5.1
Estimates ofdimensionless eddy viscosity at several levels under drifting pack iceduring
the AIDJEX 1972 Pilot Study, compared with an early large-eddy-simulation (Deardorff 1972)
(Adapted from McPhee and Smith 1976)
spectralcalculations(McPhee1994),dataweresegregatedinto1-htimeseries,from
whichtheaveragevelocitywas usedto rotate thevectorcomponentsintoa stream-
linecoordinatesysteminwhichmeanvertical
(
w
)
andcross-stream
(
v
)
components
vanish,and
U
u
.Afterlinearlydetrending
u
,spectrawerecalculatedfollowingthe
proceduredescribedinSection3.5.Spectralcomponentswerethenbinaveragedin
evenly spaced bins of log
10
(
=
where
k
is the angular wave number. The 1-h time
series wereoverlappedby half for better statistics at higher wave numbers. Twelve
estimates for each of 5 TICs ranging in depth from 4 to 24m (TIC 3 at 12m mal-
functioned),were then furtheraveragedon a commonlog
10
(
k
)
grid for a total time
span of 6h. Resulting spectra for TIC 5 at 20m have been discussed in Section 3.5
andareshownFig.3.9.Wepostulatedthatthepresenceofareasonablywelldefined
regionwhere the log-log slope of the area-preservingspectra was
k
)
−
/
2
3, accompa-
4
3
S
uu
, indicated isotropyat small scales
nied by a regionin whichthe ratio
S
ww
≈
intheinertialsubrangeoftheflow.
To test the hypothesis that
k
max
, we estimated the peak in each average
w
spectrum by determining the maximum in a high-order polynomial fitted to the
spectral density estimates. Following Busch and Panofsky (1968), the spectrum at
4m wasfittedtoa functionofthe form
λ
=
c
λ
/
kS
ww
(
k
)
A
(
k
/
k
max
)
=
(5.1)
2
u
∗
5
/
3
1
+
1
.
5
(
k
/
k
max
)