Geoscience Reference
In-Depth Information
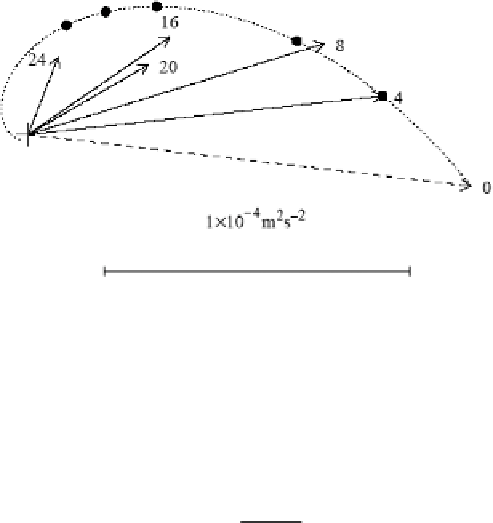
Fig. 4.4
Turbulent stress measured as five levels during a storm at Ice Station Weddell in 1992.
The dotted curve is the simple similarity model for stress, with dimensional parameters chosen
so that the stress at 4m matches observed. The dashed vector labeled “0” indicates the inferred
boundary stress (From McPhee and Martinson 1994. With permission American Association for
the Advancement of Science)
where
K
∗
=
.
02 (based primarily on estimates from AIDJEX measurements, see
McPhee1981)andthesurfacestressischosenin orderto make
0
τ
(
=
−
)=
u
w
4
+
v
w
4
z
4m
i
(4.14)
Buoyancyfluxwasnegligible,so
ξ
=
fz
/
u
∗
0
.Inthiscasethefrictionvelocitymag-
012ms
−
1
andconsequentlytheestimateofconstanteddyviscosity
nitudeis
u
∗
0
=
0
.
021m
2
s
−
1
.
Supposethatin theneutralIOBL,mixinglengthincreaseslinearlyfromthesur-
faceuntilitreachesalimitingvalue
K
∗
u
∗
0
2
is
K
sim
=
/
f
=
0
.
λ
max
=
κ
z
sl
andtheproductoffrictionspeedat
that level with
λ
max
is the maximum eddy viscosity. The dimensionless maximum
mixinglength
u
∗
0
willalsoconstituteasimilarityparameter.Ifwefur-
therassumethatattenuationoffrictionvelocityinthesurfacelayeris negligible,so
that
K
max
=
Λ
∗
=
f
λ
max
/
u
∗
0
λ
max
,then
K
∗
=
Λ
∗
.
2
4.2.2 Rossby Similarity for the Neutral IOBL
The conceptual model implicit in the Ekman solution is that for a given stress
condition,mixinglengthandeddyviscositydonotvarymuchthroughtheouterpart
oftheIOBL.Yetitisobviousthatfromtheperspectiveofvelocityshear(asopposed
to kinematic) stress, linear dependenceof
in the surface layer is quite important,
and the total shear will depend strongly on surface roughness,
z
0
. Consider Ekman
velocity and ice velocity (relative to the bottom of the boundarylayer) depicted in
λ
2
In fact there is appreciable stress attenuation inthe surface layer and
Λ
∗
issomewhat larger than
K
∗
as discussed later.