Geoscience Reference
In-Depth Information
a
0.1 m s
-
1
Ice
2 m
4 m
12 m
V
E
20 m
26 m
32 m
b
cm s
-
1
-
25
-
20
-
15
-
10
-
5
0
5
10
u component
−10
−20
v component
−30
m from ice
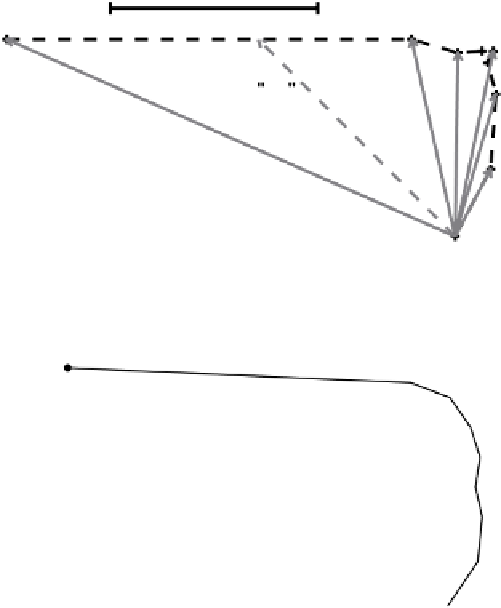
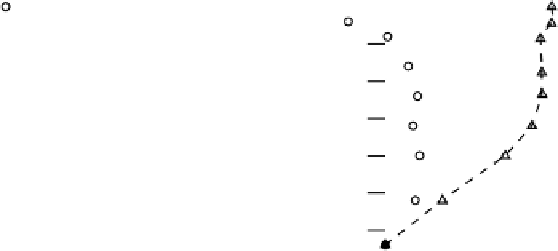
Fig. 4.1
Currents averaged for 5h during a storm at the 1972 AIDJEX Pilot Study in the western
Arctic.
a.
Planviewhodograph. Thedashed vectorrepresents velocitywherethedirectionbetween
stressandvelocityis π
/
4.
b.
Corresponding profilesintheupper32mofthewatercolumn,relative
tothe current measured at 32m
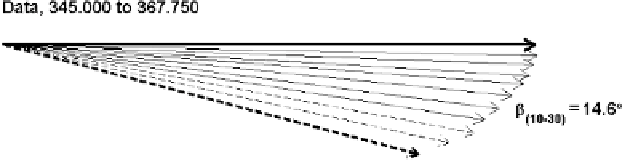
Fig. 4.2
Average nondimensional current hodograph (plan view) of complex currents measured
relative to the ice and sampled every 2m from 10 to 28m, after nondimensionalizing by the 30-m
current (McPhee 2008, in press)