Geoscience Reference
In-Depth Information
parameters all have independent dimensions, so that we can again form a dimen-
sionlessgroupthatwillremainconstantintheinertialsubrange,and
S
T
=
α
Θ
ε
T
ε
−
1
/
3
k
−
5
/
3
(3.13)
where
α
Θ
is the thermal Kolmogorov constant. Edson et al. (1991) suggested a
numerical value of 0.79 for
α
Θ
; we estimated a slightly higher value, 0.83, from
statisticsofnearly4003-hturbulentrealizationsatseverallevelsintheIOBLduring
SHEBA(McPhee2004).
In high-Reynoldsnumberturbulentflows,it is oftenassumedthatthe eddyther-
mal diffusivity is nearly the same as eddy viscosity. If it is further assumed that
thermal varianceproductionand dissipation balance, then (3.6) providesa formula
forthe magnitudeofverticalheatflux(dividedby
ρ
c
p
):
=
2
w
T
∂
w
T
T
k
max
=
ε
T
(3.14)
∂
z
c
λ
u
∗
Given
w
and
T
spectra (and no other information) it is then possible to combine
(3.14) with (3.13) and (3.12) for an estimate of the turbulent heat flux magnitude
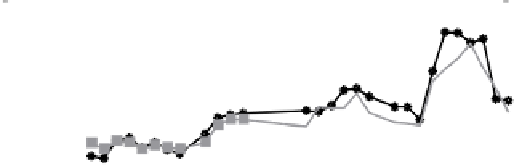
(although not direction) at a particular level. An example from near the end of the
SHEBA experiment (adapted from McPhee 2004) comparing estimates made en-
tirelyfromthespectrawithdirectcovarianceestimatesisshowninFig.3.11.
Turbulent Heat Flux, TIC 1, 4 m
30
covar estimate
spectral estimate
20
10
0
258
259
260
261
262
263
Turbulent Heat Flux, TIC 2, 8 m
30
covar estimate
spectral estimate
20
10
0
258
259
260
261
262
263
Day of 1998
Fig. 3.11
Heat flux measured by direct covariance
(
ρ
c
p
w
T
)
averaged in 3-h blocks (black
∗
)
and derived from the
w
and
T
spectra as described in the text (grey squares) at two levels near
theend of theSHEBAproject. Dashed (covariance) and dot-dashed (spectra) horizons show mean
values (Adapted from McPhee 2004. Withpermission American Meteorological Society)