Geoscience Reference
In-Depth Information
Vertical Velocity
0.02
0
−0.02
a
0
10
20
30
40
50
60
Deviatory Temperature (T
)
x 10
-
3
6
b
4
2
0
−2
−4
0
10
20
30
40
50
60
c
w*T
x 10
-
4
0
-
1
70 W m
-
2
r
c
p
<w
T
>=
-
d
-
2
0
10
20
30
40
50
60
w*S
5
x 10
-
5
0
-
5
4.6x10
-
6
psu m s
-
1
<w
S
>=
-
e
-
10
0
10
20
30
40
50
60
Minutes starting at day 98.925UT, 1992
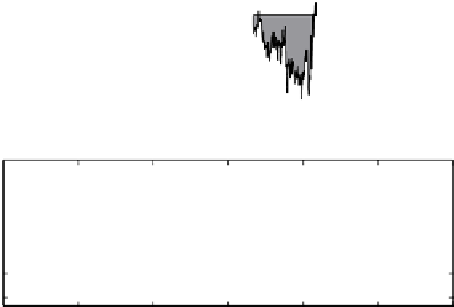
Fig. 3.3
One hour of turbulence data near midday at the edge of a freezing lead in April, 1992.
a
Vertical velocity at 14.8m, approximately halfway through the well mixed layer.
b
Deviatory
temperature.
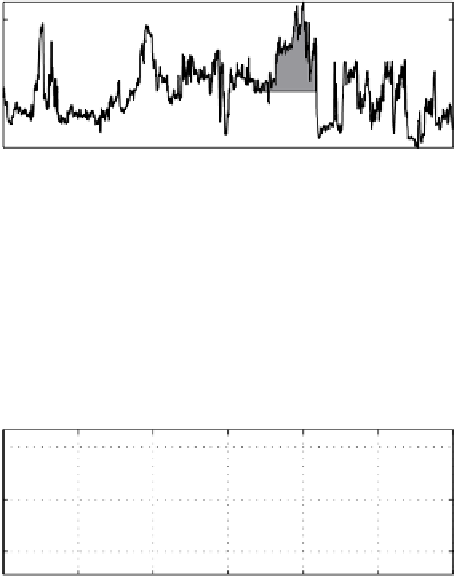
c
.Deviatorysalinityasmeasuredwithamicrostructureconductivitysensor.
e
Product
series of
w
times
T
, mean value is indicated by the dashed line, equivalent to a downward heat
flux of 70W m
−
2
.
e
wS
series, with downward salt flux from freezing. Shaded areas emphasize
large downward eddy motion starting at about minute 35