Geoscience Reference
In-Depth Information
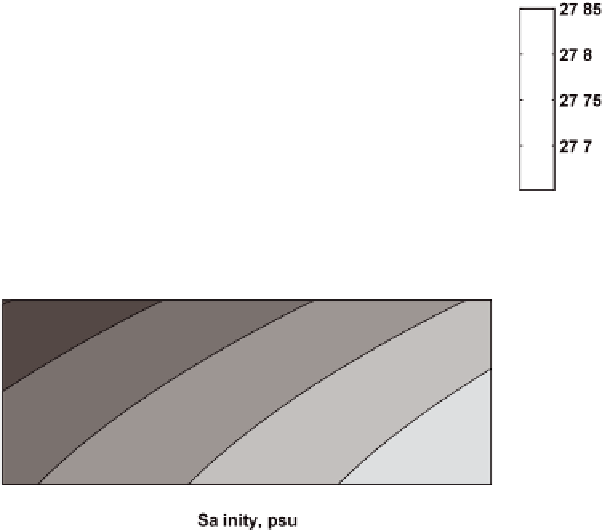
Fig. 2.11
Temperature/salinity diagrams with isopycnal contours for density calculated at
a
sur-
face pressure and
b
at pressure corresponding to the mixed layer depth.
T/S
characteristics of the
idealizedtwo-layersystemfromFigs.2.2to2.10areindicatedbysymbols(circleforupper,square
for lower). See text for further details (see also colorplate on p. 204)
Measured
T, S
,and
σ
0
profiles can be reasonably well represented in the upper
200m of the water column by a two-layer system with an upper layer thickness of
about 93m. The potential density differencebetween the two layers is quite small,
lessthan0
03kgm
−
3
.Inoceanographyitiscustomarytocomparewatermassesvia
a temperature-salinity diagram, as drawn in Fig. 2.11a. The
T/S
pairs representing
characteristics of the two (idealized) layers from Fig. 2.10 are shown as symbols
embeddedincontoursof
.
σ
0
.The
σ
0
isopyncalpassingthroughthe
T/S
pointforthe
13
◦
C
lowerlayer(with
T
l
=
63psu)isshowninwhite.Thedoublearrow
indicates the increase in salinity needed to raise the potential density of the upper
layertothatofthelower.Allelsebeingequal,thesaltrejectedfromabout13cmof
additionalice growth(atthe timethe ice was about35cmthick)wouldaccomplish
this. The dashed line connecting the modified surface water and the deeper water
in Fig. 2.11ais the so-calledmixingline, whichdescribesthe
T/S
characteristicsof
any product from conservative mixing of the two different water masses. Because
of the isopycnal curvature,the mixingline lies to the right of the isopycnal passing
throughboth the deep water and modified surface water, so any mixtureof the two
water types is denser than either of the end members. Since no consideration of
0
.
,
S
l
=
34
.