Geoscience Reference
In-Depth Information
600
0.1
Incoming Shortwave
a
400
0.09
δ
T
200
0.08
0
167
167.5
168
168.5
169
169.5
170
170.5
171
Day of 1998
2
x 10
−4
4
Mean heat flux
b
0
0
−2
−4
−
∆
T/
∆
z
−4
167
167.5
168
168.5
169
169.5
170
170.5
171
Day of 1998
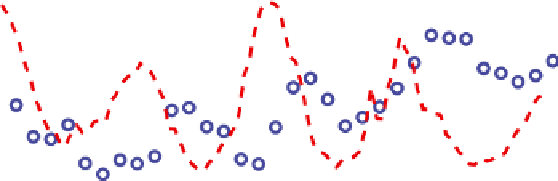
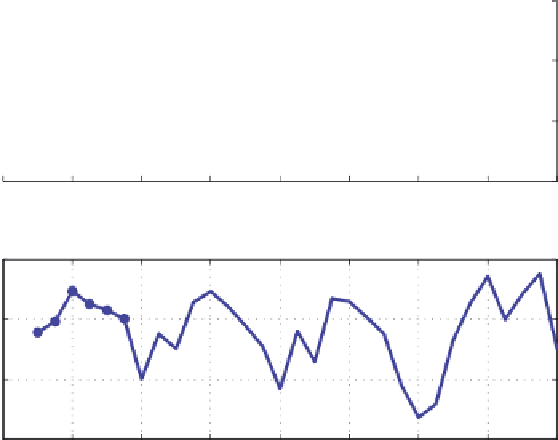
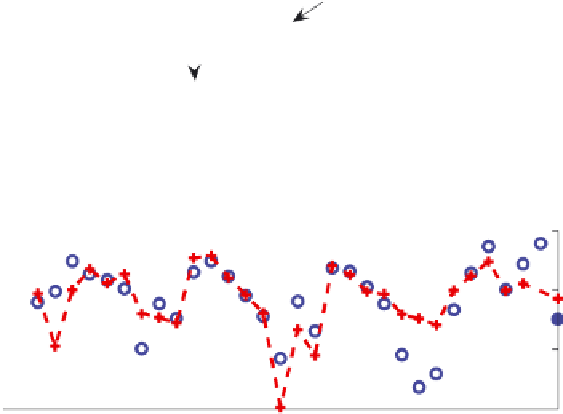
Plate 23 a
Incoming shortwave radiation at the upper ice surface (data from the SHEBA Project
Office installation, right caption) and departure of mast temperature from freezing (average of
clusters1and2at4.2and8.2m,respectively).
b
Negativetemperature gradient betweenclusters1
and 2, after adjusting temperatures to agree at times near zero heat flux, along with turbulent heat
flux averaged for both clusters (see also in black-and-white on page 148)