Geoscience Reference
In-Depth Information
Ocean−To−Ice Heat Flux
a
20
18.5
Thick ice
0
False bottom
−13.3
−20
210
212
214
216
218
220
6
x 10
−3
Effective Aggregate Heat Transfer Coefficient
b
4
2
0
0
0.05
0.1
0.15
0.2
0.25
0.3
False Bottom Area Fraction
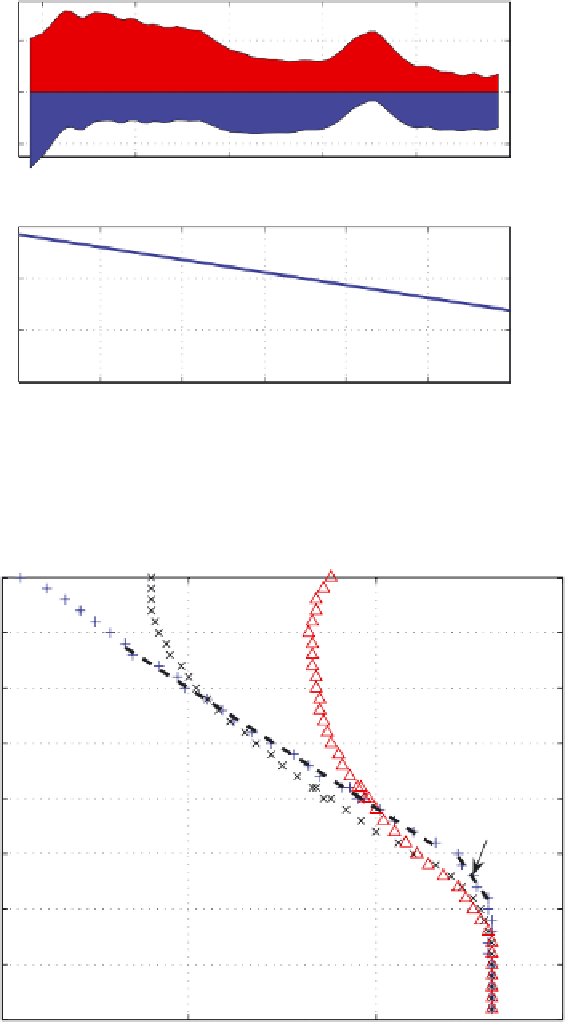
Plate 19 a
Timeseriesofheatfluxtothickice(redshading)andheatfluxintotheoceanfromfalse
bottoms (blue). Average values are shown at right.
b
Aggregate Stanton number as a function of
areal coverage of false bottoms and fresh water (Adapted from Notz et al. 2003. With permission
American Geophysical Union) (see also inblack-and-white on page 124)
Ice temperatures during Svalbard 2001 experiment
0
9 Mar 01 11:37UT
−10
10 Mar 01 10:10UT
−20
8 Mar 01 15:16UT
−30
−40
T
z
=−10.5 K m
−1
T
z
=−23 K m
−1
−50
(Data courtesy J. Wettlaufer & G. Worster)
−60
−70
−80
−15
−10
−5
0
C
°
Plate 20
Ice temperature profiles on three days in fast ice on VanMijen Fjord, Svalbard (see also
inblack-and-white on page 128)