Geoscience Reference
In-Depth Information
Contours of
σ
0
27.85
0
a
27.8
−0.5
27.75
−1
27.7
δ
S=0.034
−1.5
34.45
34.5
34.55
34.6
34.65
Salinity, psu
Contours of
σ
0.093
28.35
0
b
28.3
−0.5
28.25
−1
28.2
28.15
−1.5
δ
S=0.027
28.1
34.45
34.5
34.55
34.6
34.65
Salinity, psu
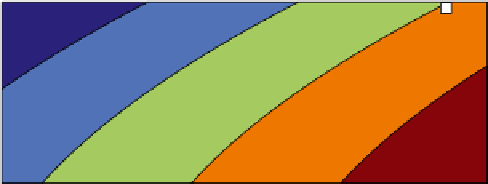
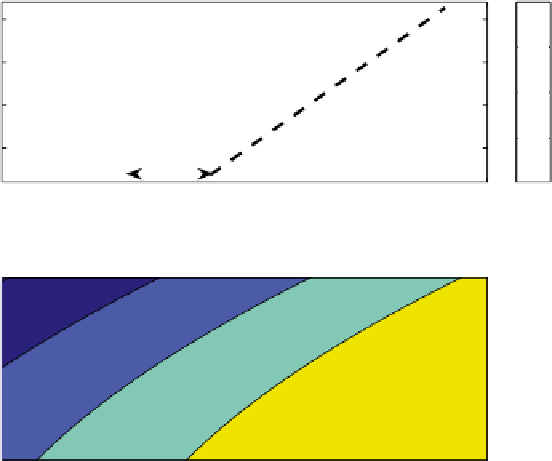
Plate 15
Temperature/salinitydiagramswithisopycnal contoursfordensitycalculatedat
a
surface
pressure and
b
at pressure corresponding tothe mixed layer depth.
T/S
characteristics of the ideal-
ized two-layer system from Figs. 2.2 to2.10 are indicated by symbols (circle for upper, square for
lower). See text for further details (see also inblack-and-white on page 32)