Geoscience Reference
In-Depth Information
1/2
, 01−Oct−1997 to 01−Jan−1998
u
*
0
=
1/2
, 01−Jan−1998 to 01−Apr−1998
τ
u
*0
=
τ
0.03
0.03
0.02
0.02
0.01
0.01
0.007
0.007
0
0
280
290
300
310
320
330
340
350
360
10
20
30
40
50
60
70
80
90
a
b
H
f
=
ρ
c
p
<w'T'>
0
, 01−Oct−1997 to 01−Jan−1998
H
f
=
ρ
c
p
<w'T'>
0
, 01−Jan−1998 to 01−Apr−1998
1.5
40
30
1
20
0.5
10
0.3
3.3
0
0
280
290
300
310
320
330
340
350
360
10
20
30
40
50
60
70
80
90
Day of 1998
Day of 1997
1/2
, 01−Apr−1998 to 01−Jul−1998
1/2
, 01−Jul−1998 to 01−Oct−1998
u
*0
=
τ
u
*0
=
τ
0.015
0.03
0.01
0.02
0.005
0.005
0.01
0.008
0
0
100
110
120
130
140
150
160
170
180
190
200
210
220
230
240
250
260
270
c
d
H
f
=
ρ
c
p
<w'T'>
0
, 01−Apr−1998 to 01−Jul−1998
H
f
=
ρ
c
p
<w'T'>
0
, 01−Jul−1998 to 01−Oct−1998
40
100
30
20
50
10
7.0
18.1
0
0
190
200
210
220
230
240
250
260
270
100
110
120
130
140
150
160
170
180
Day of 1998
Day of 1998
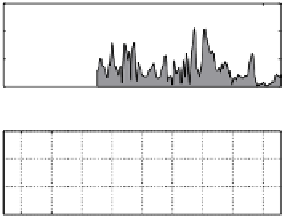
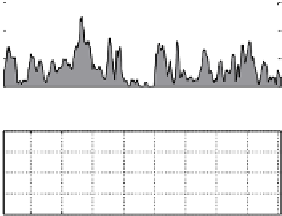
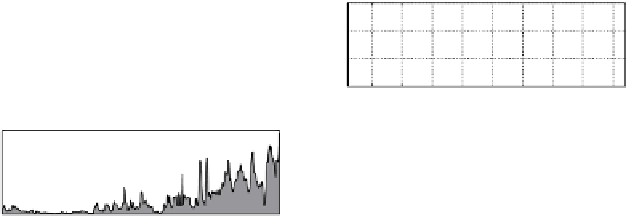
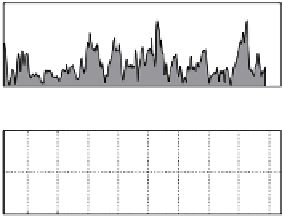
Fig. 9.13
Modeled interface friction velocity and basal heat flux by quarter during the 11-month
SHEBA project. Mean values for each quarter are indicated by the labeled lines.
a
1997Q4;
b
1998Q1;
c
1998Q2;
d
1998Q3
A summary over the entire SHEBA project (Fig. 9.14) shows the mean friction
velocitytobe6
7Wm
−
2
.Thetimeserieshave
beensmoothedwithaone-weekrunningmean.Errorsinthemodeledinterfaceflux
quantities arise mainly from uncertainties in specifying
z
0
and the heat exchange
coefficient. In an independent study (McPhee et al. 2003), the bulk heat exchange
coefficientwasreportedas0
7mms
−
1
andbasalheatfluxtobe7
.
.
.
0057
±
0
.
0004.Forthe interfacemodel,this impliesa
rangeof0
.
0088
≤
α
h
<
0
.
0102(whenice is melting).Similarly,based onthe stan-
darddeviationoflog
(
z
0
)
discussedabove,aprobablerangeforhydraulicroughness
is 0
.
016
≤
z
0
≤
0
.
146m. The model was run with combinations of both minimum
z
0
and
α
h
. The corresponding ranges in
u
∗
0
and basal
heatflux areshown by theshadedregionsin Fig. 9.14.Rangesfor meanvaluesare
5
α
h
and maximum
z
0
and
H
f
≤
43Wm
−
2
. If the missing October
values are estimated as the averages of September 1998, and November 1997, the
most likely average annual friction velocity for the SHEBA year was 6
95mms
−
1
,and6
.
75
≤
u
∗
0
≤
7
.
.
25
≤
9
.
8mms
−
1
.
2Wm
−
2
. For the period 2 June 1998 to
theendoftheturbulenceproject,themostlikelyaverageheatfluxwas17
and annual average basal heat flux was 7
.
6Wm
−
2
.
Perovichetal.(2003)estimatedthesummerbasalheatfluxfromthebottommelting
observed at 77 mass balance sites scattered across many different ice types on the
.