Geoscience Reference
In-Depth Information
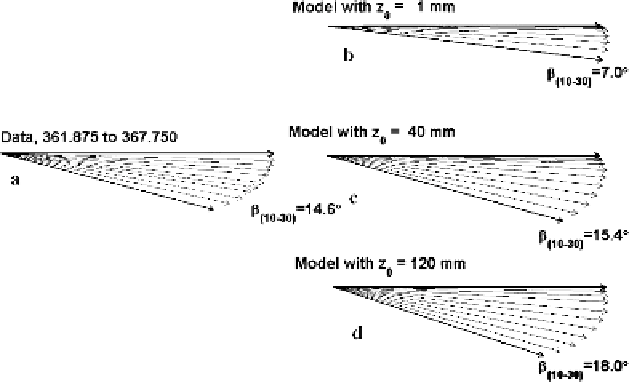
Fig. 9.10 a.
Average of 43, 3-h average current hodographs divided by the current vector at 30m
(horizontal vector) for times when
|
V
30
|≥
0
.
06ms
−
1
. Vectors are drawn every 2m from 10 to
30m. The total Ekman angular shear between 10 and 30m is β
10
-
30
=
14
.
6
◦
.
b, c
Average model
dimensionless hodographs for the same timeswiththree different
z
0
values (From McPhee 2008)
9.3.2 Underice Hydraulic Roughness for SHEBA
A primary aim of the year-long SHEBA project was to characterize multiyear ice
in the western Arctic at scales useful for large scale modeling of air-ice-ocean in-
teraction, with particular attention to importantterms in the surface energy budget.
Asdiscussedearlier,weoftenobservedduringtheyear-longprojectthatturbulence
increasedwithincreasingdistancefromtheice/oceanboundary.Thissuggestedthat
deeper clusters were sensing upstream obstacles at increasingly distant fetch, in-
cluding a prominentpressure ridge roughly 100m away. We noted large variations
in apparent roughness as drift direction and floe orientation varied over the year-
long deployment. By considering, stress, velocity, and apparent eddy viscosity at
the TIC nearestthe interface,we developeda techniquethat included
as inferred
from spectral peaks as an independent parameter (McPhee 2002). This minimized
theeffectof upstream heterogeneityin the flowfor determiningthe localhydraulic
roughnessofundeformedice, andprovidedan estimateofaround6mmfortheun-
dersurfacehydraulicroughness.Weemphasizedthatthisvaluewas
not
indicativeof
the “aggregate” floe roughness, which would include added drag from ridge keels
andfloeedges,orreductionfromopenwaterorsmoothice.
During the relocation of the SHEBA oceanography program after the floe
breakup in March 1998, we drilled undeformed ice in numerous location, looking
for slightly thicker hummocks from the previous summer melt period, obscured
at the surface by the winter snow accumulation. These were thought to be the
most likely locations for siting instruments and shelters that would survive the
upcoming summer melt. We typically found about 20cm difference between ice
thickness in hummocks versus “fossil” melt ponds. Laboratory studies show that
λ