Geoscience Reference
In-Depth Information
V
8
a
V
4
Day 343.625
z
0
=0.79 cm
u
*0
= 11.8 mms
-
1
|V
geo
| = 5.0 cms
-
1
V
0
β
=16.7
°
V
ice
0.1 ms
−1
°
C
|
1/2
H
f
=
ρ
c
p
<w'T'>
Modeled Eddy Diffusivity
u
*
=|
τ
−1.5
−1
−0.5
−2
0
0
0
0
b
c
d
e
−10
−5
−5
−5
−20
−10
−10
−10
Model ML Extent
−30
−15
−15
−15
Model
H
f0
TICs
−40
−20
−20
−20
−50
−25
−25
−25
Model
u
*0
TICs
−60
−30
K
H
K
m
λ
u
*
−30
−30
−70
−35
−35
−35
T
S
−80
−40
−40
−40
26
28
30
32
34
0
0.01
0.02
0.03
0
0.005
0.01
0.015
−10
−5
0
5
psu
m
2
s
−1
m s
−1
W m
−2
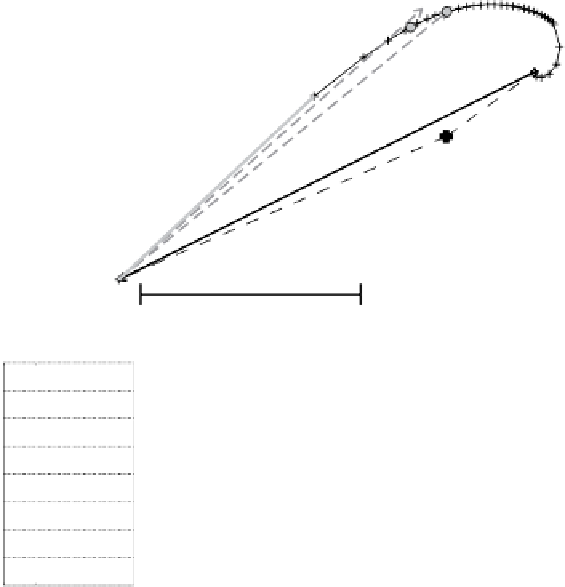
Fig. 9.8
SLTC model realization for 3-h periods centered at 15:00 UT on 9 December 1997 dur-
ing SHEBA.
a
model hodograph;
b
observed potential temperature and salinity profiles in model
domain;
c
eddy viscosity/diffusivity.
d
friction velocity;and
e
turbulent heat flux
at 6m, andestablishes
V
0
, the vectorice velocityrelative to the undisturbedocean.
This differs from the actual ice velocity obtained by satellite navigation
V
ice
)
by “
V
geo
” where quotes indicate that this is a combination of actual geostrophic
flow plus any inertial or baroclinic motions, which are not considered in the SLTC
model.
1
One other example from early in the SHEBA project (Fig. 9.8) demonstrates a
rare period during winter when there was downward turbulent heat flux in the wa-
ter column, despite a lack of short wave radiation (the sun had set) and enough
∆
(
T
to imply a positive basal heat flux of about 1Wm
−
2
. There was a rather dra-
matic increase in stress from 8 to 12m (Fig. 9.8d), probably from enhanced stir-
ring by a pressure ridge keel about 110m to the SW. Although not seen at the
scale shown in Fig. 9.8b, there is a positive potential temperature gradient in the
1
“
V
geo
” willalso reflect any uncertainty inalignment of theturbulence mast, which often depends
on compass headings and a model for magnetic declination.