Geoscience Reference
In-Depth Information
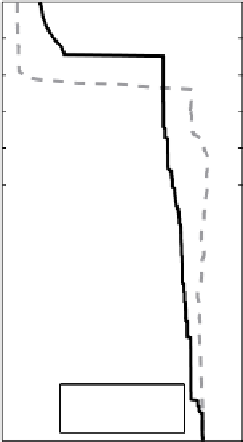
NES Model Temperature
Salinity
-
50
-
50
-
100
-
100
-
150
-
150
-
200
-
200
-
250
-
250
-
300
-
300
350
350
-
-
-
400
-
400
-
450
-
450
-
500
-
500
231.50
251.50
-
550
-
550
-
2
-
1
0
1
34.45 34.5 34.55 34.6 34.65
C
psu
Fig. 8.26
Start and end temperature and salinity profiles for the NES model, run for 20 days with
MM5forcing, initializedtoMaudNESS station91
takes no account of horizontal gradients and associated geostrophic shear, as well
asadvectionofWDWandEkmantransportinthe IOBL,cannotexpectto fullyde-
scribe changesoverthree weeks. However,from an heuristic viewpoint,the results
fortheMaudNESSsimulationsuggesthowsomeoftheotherwisepuzzlingfeatures
encounteredin thelowstabilityregimesnearMaudRise comeabout.
References
Grenfell, T. C. and Maykut, G. A.: The optical properties of ice and snow in the Arctic Basin. J.
Glac., 18, 445-463 (1977)
Light, B., Grenfell, T. C., and Perovich, D. K.: Transmission and absorption of solar
radiation by Arctic sea ice during the melt season, J. Geophys. Res., 113, C03023,
doi:10.1029/2006JC003977 (2008)
McPhee, M. G.: Analysis and prediction of short term ice drift. Trans. ASME J. Offshore Mech.
Arctic Eng., 110, 94-100 (1988)
McPhee, M.G.:Marginal thermobaric stabilityintheice-covered upper ocean over Maud Rise. J.
Phys. Oceanogr., 30, 2710-2722 (2000)
McPhee, M. G.: Turbulent stress at the ice/ocean interface and bottom surface hydraulic
roughness during the SHEBA drift. J. Geophys. Res., 107 (C10), 8037 (2002), doi:
10.1029/2000JC000633
McPhee, M. G. and Smith, J. D.: Measurements of the turbulent boundary layer under pack ice. J.
Phys. Oceanogr., 6, 696-711 (1976)