Geoscience Reference
In-Depth Information
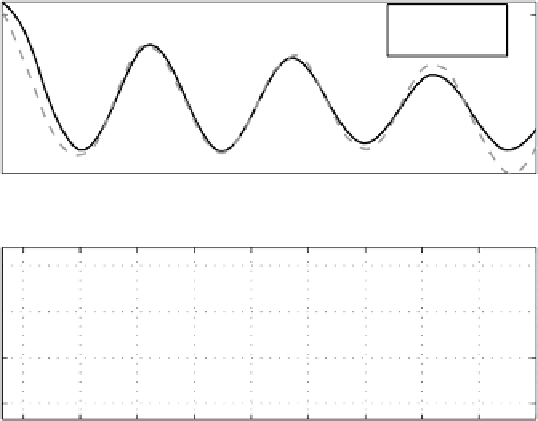
Model Sep 20A: Northward Ice Velocity
0.3
Data
Model
0.2
0.1
0
263.2
263.4
263.6
263.8
264
264.2
264.4
264.6
264.8
265
Eastward Ice Velocity
0.2
0.1
0
−0.1
263.2
263.4
263.6
263.8
264
264.2
264.4
264.6
264.8
265
Day of 1998
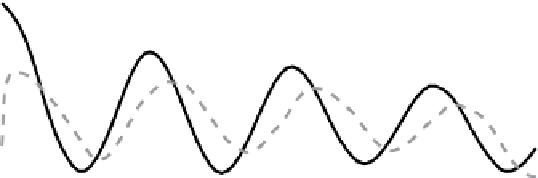
Fig. 8.16
Simulated surface velocity compared with observed for a model forced by observed
wind and started from rest at a time of high wind stress and large inertial motion. The model
quicklyadjuststothestressforcing, butgeneratesitsowninertialoscillationsoutofphasewiththe
observations
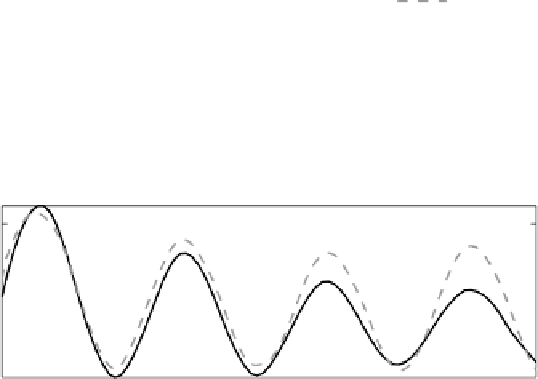
Model Sep 20B: Northward Ice Velocity
0.3
Data
Model
0.2
0.1
0
−0.1
263.2
263.4
263.6
263.8
264
264.2
264.4
264.6
264.8
265
Eastward Ice Velocity
0.2
0.1
0
−0.1
263.2
263.4
263.6
263.8
264
264.2
264.4
264.6
264.8
265
Day of 1998
Fig. 8.17
ResultsfromamodelidenticaltothatofFig.8.15exceptthattheinitialvelocitystructure
isspecifiedbysolvinga“steady”versionoftheIOBLmodelgiventhewindstressattime263.125,
and adding the inertial component of velocity from satellite navigation analysis to the well mixed
layer velocities