Geoscience Reference
In-Depth Information
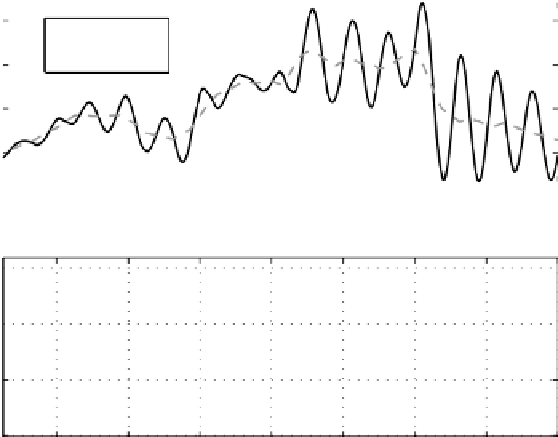
Model Sep 14D: Northward Ice Velocity
0.3
Data
Model
0.2
0.1
0
a
258
259
260
261
262
263
264
265
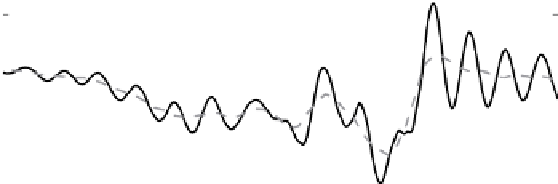
Eastward Ice Velocity
0.2
0
−0.2
b
−0.4
258
259
260
261
262
263
264
265
Day of 1998
Fig. 8.13
Velocity (dashed) used to force the model run Sep 14D, compared with the actual ice
velocity.
a
Northward component;
b
southward component
as the ice velocity after removing inertial components (i.e., forced by the
V
0
term
in [2.22]). Surface velocity used to force the model is shown as the dashed curves
in Fig. 8.13. Differencesin results fromthe models forcedby the completesurface
velocity (run Sep 14C) and by surface velocity with inertial components removed
are summarized at two levels in Figs. 8.14 and 8.15. The ML/Pycnocline level is
definedasthedeepest
z
(flux)gridpointinthewellmixedlayer,i.e.,where
g
ρ
∂ρ
∂
N
2
10
−
5
s
−
2
=
−
z
≤
1
.
5
×
It varieswith time,butbecauseof thestronginitial stratification,remainsrelatively
shallow,averagingabout15.4mforeachrun.
That there is little difference in
u
∗
0
between the models is not surprising
(Fig. 8.14a) — we seldom see much inertial component in velocity measured
near the ice (in a reference frame drifting with the ice), because the ice and upper
ocean oscillate in phase, and mean shear is not much affected. Near the base of
the well mixed layer, it is not obviousthat inertial shear would be so unimportant,
butaccordingto the modelcomparisons(Fig. 8.14b),the impactremainsrelatively
small. Similar results hold for the turbulent heat flux. There is some reduction in
mean heat flux when inertial oscillation is removed:about 6% near the base of the
well mixed layer, and 4% at the interface. Nevertheless, it appears that even with