Geoscience Reference
In-Depth Information
SHEBA Profiler Upper Ocean Salinity
0
32.5
a
32
-
20
31.5
31
-
40
30.5
30
-
60
258
259
260
261
262
263
264
265
Day of 1998
Model Upper Ocean Salinity
32
Run Sep 14A
-
10
b
31.5
-
20
31
-
30
-
40
30.5
-
50
30
-
60
258
259
260
261
262
263
264
265
Day of 1998
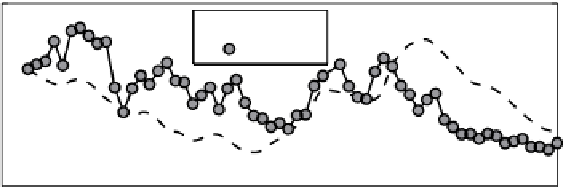
Fig. 8.10
Contour plots of salinity in the upper ocean from SHEBA profiler
a
and wind-driven
model Sep 14A
b
(see also Colorplate on p. 211)
Average
δ
T, 3−15 m
0.03
Model
Profiler
0.025
0.02
0.015
Run Sep 14B
0.01
257
258
259
260
261
262
263
264
265
Day of 1998
Fig. 8.11
Comparison of modeled and observed dT for model Sep 14B with a small negative
salinitysource term as an approximation to advective flux
relatively small horizontal gradients encountered as the ice drifts will swamp the
signal from local vertical exchanges. On the other hand, vertical fluxes are often
relatively immune to horizontal property gradients except in front-like conditions,
henceingeneralprovideasuperiorassessmentoftheparticularmixingschemeused
inthemodel.