Geoscience Reference
In-Depth Information
δ
T, 1−15 m
0.1
0.095
f
sw
=0.10
a
0.09
0.085
0.08
0.075
f
sw
=0.08
Profiler
167
167.5
168
168.5
169
169.5
170
170.5
171
Day of 1998
Friction velocity at 8 m
0.01
b
0.005
0
167
167.5
168
168.5
169
169.5
170
170.5
171
Day of 1998
Turbulent Heat Flux at 8 m
c
5
0
−5
−10
−15
167
167.5
168
168.5
169
169.5
170
170.5
171
Day of 1998
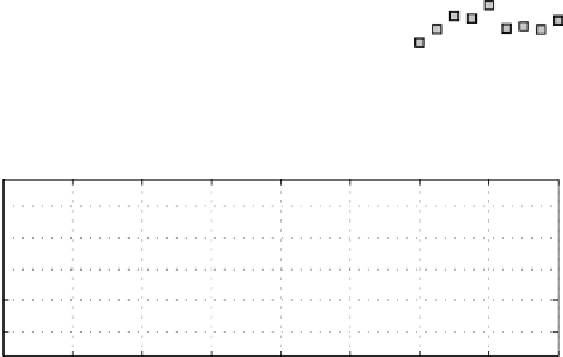
Fig. 8.4 a
Comparison of model well mixed layer temperature elevation above freezing in the
upper 15m of the water column with results from the SHEBA profiler. Dashed curve is for
f
SW
=
0
.
09, envelope limitsare shown.
b
Modeled (dashed curve,
f
SW
=
0
.
09) and observed fric-
tion velocity at 8m (error bars indicated
±
one standard deviation of the 15-min realizations in
each 3-h average).
c
Modeled and observed turbulent heat flux at 8m
typicallyreducethesurfacealbedosignificantlyandprovidea potentialconduitfor
short wave radiation entering the ocean. Still, discussions with G. Maykut (2000,
personalcommunication)andothersimpliedthat, giventhe highlycompactsea ice
coverintheSHEBAregion,itwasunlikelythatmuchmorethan4%oftheincoming
radiationwouldbeabletotransittheicepack,givencommonlyacceptedvaluesfor
shortwave broadband ice extinction coefficients (e.g., Grenfell and Maykut 1977).
This was half or less than the amount of heating needed to produce the observed
diurnal variation. The possibility of the ocean measurements being contaminated