Geoscience Reference
In-Depth Information
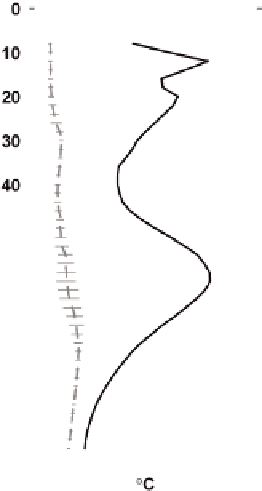
Fig. 1.3
Comparison of September average temperature
a
and salinity
b
inthe upper 100mof the
watercolumnatAIDJEXstationSnowbird in1975 (29 profiles, mean position:74
◦
13
N,141
◦
22
W) and from the Ice-Tethered Profiler buoy number 6 in 2007 (58 profiles, mean position: 76
◦
37
N, 142
◦
58
W. Horizontal bars indicate
±
one standard deviation.
c
Change in temperature with
total change in heat content.
d
Decrease insalinity,withequivalent change insaltcontent