Geoscience Reference
In-Depth Information
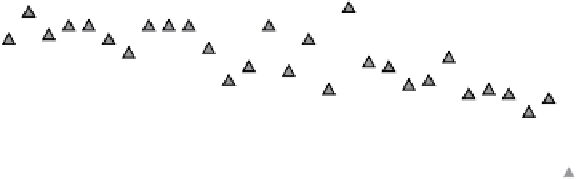
September Ice Extent, Northern Hemisphere
8
-
1.6x10
6
km
2
/decade
7
6
−0.36x10
6
km
2
/decade
5
4
1980
1985
1990
1995
2000
2005
Year
Fig. 1.1
Average Arctic ice extent in September (minimum) for the years 1979-2006, from the
National Snow and Ice Data Center website. Two linear regressions are shown withslopes labeled
for the period 1979-1996 and 1997-2007 (NSIDC data, Fetterer et al.2007)
is the accelerating reductionin ice extent(Fig. 1.1),which since late1978 has been
accurately measured with satellite-borne passive microwave sensors. Note that de-
spitetheoveralltrend,duringtheearlierpartofthesatelliteera,wheneveramarked
minimum occurred in September extent, it was nearly always followed in the next
yearbyasignificantrebound;e.g.,themaximumSeptemberextentoccurredin1996
afterthepreviousrecordminimum.Since1997thishasnotheld,andalinearregres-
sionofminimumiceextentwithtimeinthelastdecadeshowsamarkedlyincreased
rate ofdecline comparedwith theprevioustwo decades.A continuationor acceler-
ationoftherate ofdecreaseobviouslyimpliesthat theArctic will beseasonallyice
freebymid-century.
If ice-albedofeedbackis amajorfactorinthe retreatofthe Arcticicepack,then
ice concentrationduring maximum sun elevation (June) should be a strong indica-
tor of the state of the pack, perhaps a better diagnostic than minimum ice extent,
since it is probably less subject to transient atmospheric conditions that can move
ice near the marginal ice zones. The anomaly in total ice area relative to the aver-
age from 1979 to 2000 (Fig. 1.2) shows mostly the same trend as minimum extent
(the correlation coefficient is 0.85), yet there is an interesting plateau in the eight
years following 1997. While this suggests that perhaps the ice pack had reached
some sort of equilibrium not obvious in the minimum ice extent records, in 2006
and again in 2007, the area has dipped precipitously, with nearly a million square
kilometers more open water in June now than during the plateau period.
3
Possibly
moreominousfromthestandpointofsurvivalofthesummericepackaremodeling
estimatesbyRigorandWallace(2004)andmorerecentlyfromsatellitescatterome-
terdata(Nghiemetal.2006)thattheareacoveredbyperennialicehasdecreasedby
as much as 2.5 million square kilometers since 1958. One cannot help but wonder
what,ifany,processescouldreversetheseimportanttrends.
InsomepartsoftheArctic,changesintheicecoverappeartobeaccompaniedby
changesin thetemperatureandsalinitystructureoftheupperoceanthatarenoless
3
Forperspective, thearea of Alaskais about 1.7 millionsquare kilometers.