Geology Reference
In-Depth Information
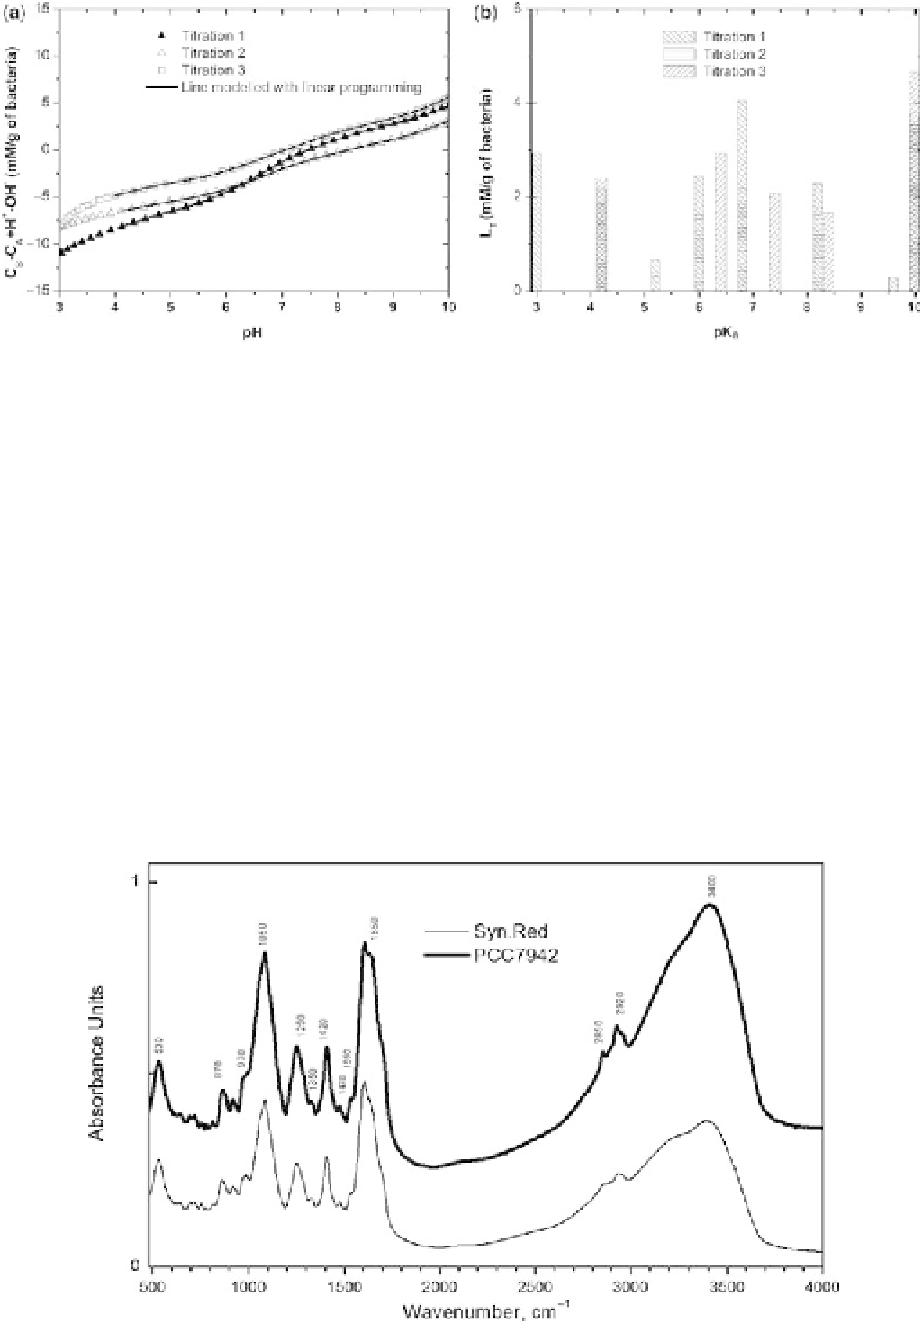
Fig. 3. (a) Charge excess (mM g
21
of bacteria) measured by potentiometric titration for EPS from Syn. Green, also
shown are results of linear programming as lines. (b)pK
a
spectra determined by linear programming analysis for each of
the titration curves shown in Figure 3a. The symbols of bars are correspondent to the titration curves in Figure 3a.
The position of the bar reflects the pK
a
value and the height of the bar reflects the concentration of a binding site.
The titration curves, which have approximately
the same shape for all three strains, showed that
EPS influences the buffering capacity of the electro-
lyte. The functional groups are de-protonating due
to the addition of the base. The reproducibility of
the buffering capacity of three strains is variable.
The data for Syn. Green exhibit an excellent repeat-
ability (Fig. 3a), whilst data for PCC 7942 (Fig. 1a)
and Syn. Red (Fig. 2a) have a rather poor
reproducibility.
The variation of the buffer capacity can be
caused, on one hand, by variations in batch cultures
at different times and, on the other hand, by the
impact of the extractive procedure on polysacchar-
ides. Polysaccharides were extracted from the
strains' batch cultures. The batch cultures represent
a mixture of cells and the production of different
strains may vary (Mata et al. 2008). Furthermore,
the polymers substances of three strains have
slightly different compositions, as we already
observed different surface properties of the investi-
gated strains by infrared spectroscopy (Dittrich &
Sibler 2005).
For PCC 7942, the site identified within the
pK
a
range 3-4.6 is likely to correspond to a car-
boxylic group (Cox et al. 1999; Fowle & Fein
Fig. 4. Reflectance-absorbance FTIR spectra of extracellular polymers produced by cyanobacteria. The spectra have
been vertically displaced for the sake of clarity. AU means absorbance units.
Search WWH ::

Custom Search