Geology Reference
In-Depth Information
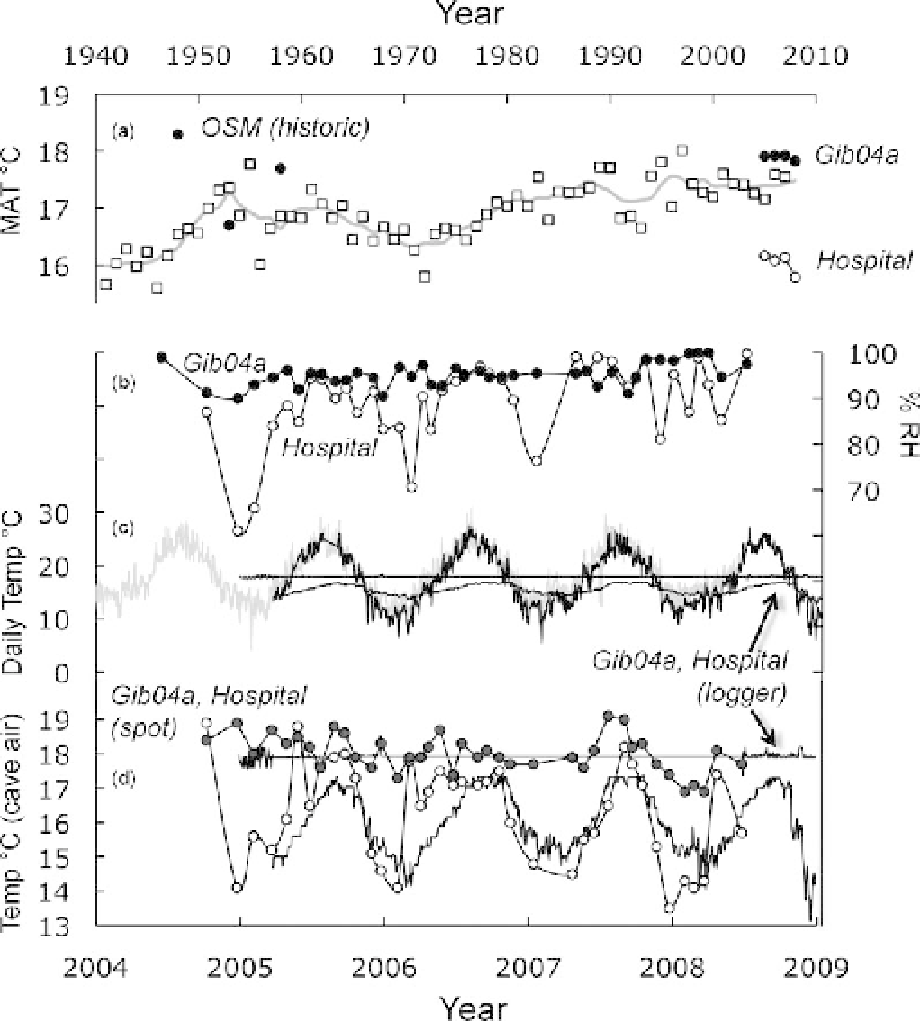
Fig. 4. Temperature and humidity variations from 2004 - 2009. (a) Mean annual temperatures (MAT) at the airport
(open squares), adjusted by 1.22 8C to be comparable with the cave data as described in the text, compared with historic
OSM spot data and MAT from logging at cave sites Gib04a (closed circles) and Hospital (open circles). (b) spot relative
humidity measurements at the Gib04a and Hospital sites. (c) Comparison of daily mean temperature measurements
measured at seal level by the Met Office (grey) and at the cave entrance (black) with daily average cave air temperatures
measured at the Hospital (weak seasonality) and Gib04a sites (flat line). (d) Spot temperature measurements compared
with logged temperatures at the Gib04a and Hospital sites. The Hospital site displays much larger variations than
Gib04a, which lies deeper in the cave interior. Meteorological data # The Met Office, UK.
However these subsidiary detections were spread
along the length of the cave, indicating that percola-
tion of the DY96 took place along a principal
channel feeding the flowstone site, but was also
spread laterally through a network of subsidiary
channels. The horizontal angle across which this
spread occurred was 708, which is similar to the
vertical angle of spread displayed by the Photine
tracer. The angle between vertical and the pathway
to the flowstone site is 308. Taking the patterns of
Search WWH ::

Custom Search