Geology Reference
In-Depth Information
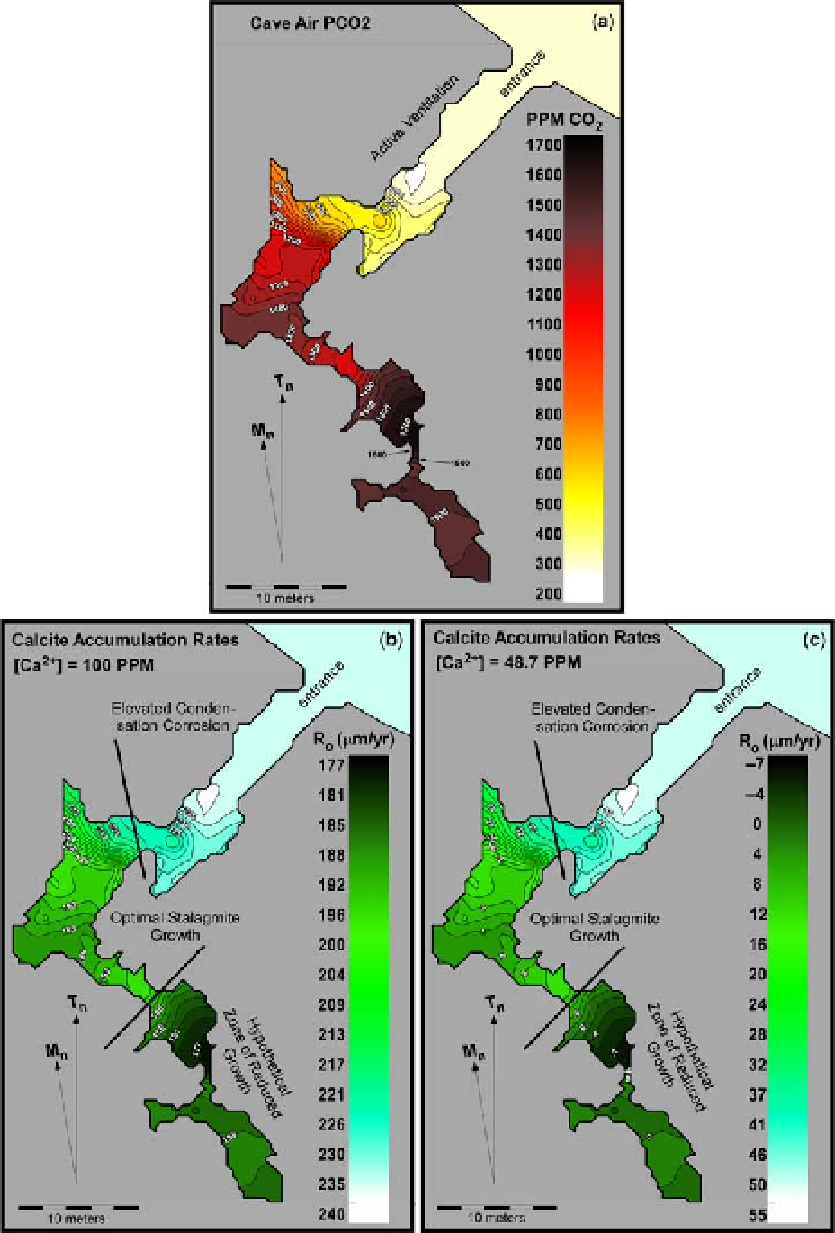
Fig. 3. (a) The measured spatial variability in P
CO
2
in Ballynamintra Cave, Ireland (Baldini et al. 2006). (b) The calcite
precipitation rate calculated assuming the P
CO
2
distribution shown in panel A, [Ca
2þ
] ¼ 2.5 mmol L
21
, a drip rate of one
drip every 60 seconds, cave temperature ¼ 10 8C, a kinetic constant (a) ¼ 0.0001275 mm s
21
, and a thin film thickness
(d) ¼ 0.1 mm. All growth determining variables were kept constant spatially except for the P
CO
2
: Growth rates were
calculatedusingtheequationspresentedinBaldini et al. (2008),whichwereadaptedfromprevious research(e.g.Buhmann
& Dreybrodt 1985a; Dreybrodt 1999; Kaufmann 2003). (c) The calcite precipitation rate calculated using all the same
values for growthdetermining variables as for panel B, with the exceptionof [Ca
2þ
]whichwas reduced to1.25 mmol L
21
.
Search WWH ::

Custom Search