Geology Reference
In-Depth Information
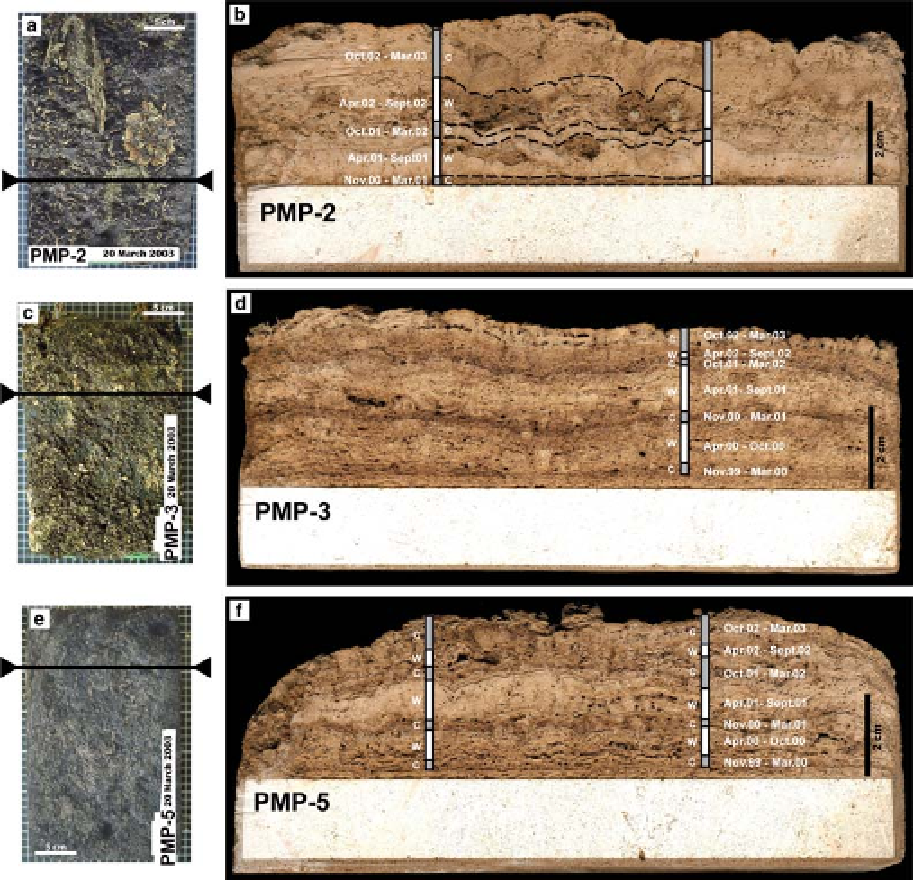
Fig. 5. Views of tufa deposited on tablets 2, 3 and 5 placed in fast flowing water areas from August 1999 - March 2003.
Tablet 2 was installed at the end of October 2000. (a), (c) and (e): overhead views with indication of the
cross-section cuttings shown in (b), (d) and (f). In (d) and (f) the colonization phase at the base corresponds to August -
November 1999. The sediment thickness of the cool and warm periods shown in (b), (d) and (f) is that obtained with the
MEM at the corresponding lines of measurement. Notice the lamination in the three of them.
There are two thick light intervals that correspond to
the warm periods of 2000 and 2001 (Fig. 5d, f) and
up to three thin dark intervals formed in cool
periods. In general, the alternating light and dark
intervals made identification of six-monthly inter-
vals easier. However, the identification of other
intervals on some sections was not possible
without the thickness data obtained with the
MEM, as those did not follow the thick light and
thin dark pattern. This is the case of the record of
April - September 2002 in tablet 3 (Fig. 5d), which
corresponded to a thin slightly dark interval.
Another case is the last six-month cool period
(October 2002 - March 2003) that recorded
higher-than-normal thickness in almost all studied
tablets. This record appears as a thick light deposit
that parallels the previous light warm period
deposit without any variation in colour or other
morphological features (e.g. in tablets 2 and 5,
Fig. 5b, f).
Sedimentary record from tablets in standing
to slow flowing water areas
No distinct sedimentation intervals could be
distinguised from the tablet cross-sections alone
Search WWH ::

Custom Search