Environmental Engineering Reference
In-Depth Information
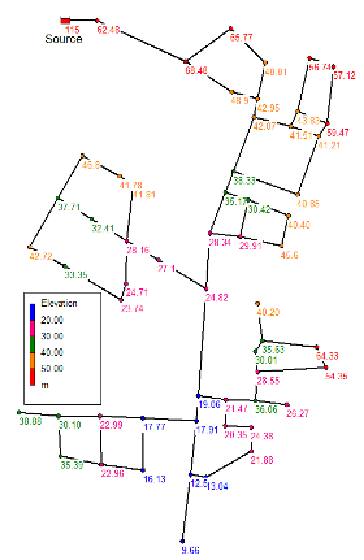
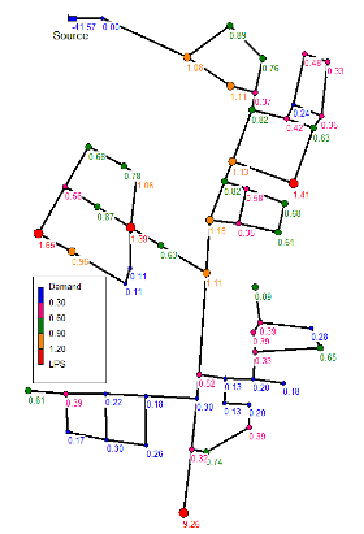
Figure 3.17
Combined gravity network layout: node elevations (msl, left) and demands (l/s, right)
The network main characteristics have been shown in Figures 3.16 and 3.17. The total
demand is 41.57 l/s supplied by gravity from the reservoir with the head of 115 msl. The
roughness factor has been set between 0.5 and 2 mm, based on the estimated pipe age.
Table 3.18 shows the results of the PDD hydraulic simulations for the PDD pressure range
between -10 and 20, mwc. They are obviously all the same as the network is just a normal
gravity network without high elevated nodes that could cause negative pressures.
More difference in the results will be obtained while failing the pipes. All 72 pipes have been
failed, one by one, and the corresponding available demand calculated. The selection of
results has been shown in Tables 3.19 to 3.21. Table 3.19 shows nine pipes: 72, 1, 3, 6, 19,
25, 27, 28, and 29, all belonging to the main route going through the middle, as can be seen in
Figure 3.15. For these pipes, the convergence could have not been reached in the 'pdd2' and
partially 'pdd4' variant (the highlighted cells), after 99 iterations. Furthermore, three
peripheral pipes have been added: 41, 48, and 61, each one connecting a branch to the main
route, where the convergence has been reached in all the variants. In all 12 cases, the closure
of the pipe breaks the network integrity, the results for the part of the network behind the
closed pipe then relying on the basic algorithm of EPANET. Without having a connection to
alternative source, this part of the network would obviously have no supply in reality.

Search WWH ::

Custom Search