Environmental Engineering Reference
In-Depth Information
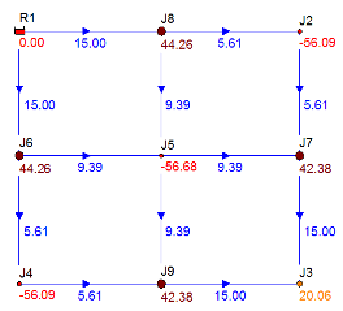
of the elevations in additional two nodes,
J2
and
J4
, as long the pressure in node
J3
is
sufficient; this has been illustrated in Figure 3.11.
Figure 3.11
PDD by Pathirana (2010), increased
z
of
J2
,
J4
and
J5
- pipes: Q (l/s), nodes: p/ρg (mwc)
No matter how little possible the situations in Figure 3.10 and 3.11 are in reality, the PDD
model shows the results that would hardly be possible, too. However, the hydraulic picture in
Figure 3.11 on the right is correct. All three demand nodes,
J2
to
J4
, are elevated higher than
the reservoir, and the total demand therefore equals zero; all the node pressures respond to the
reservoir head of 50 msl. The full supply has been provided in node
J3
in Figure 3.11 on the
left, despite the fact that all the routes from the reservoir towards this node go via extremely
high elevated nodes. Because the entire demand of nodes
J2
and
J4
has been lost, low friction
losses enable the pressure in node
J3
to build above the PDD threshold of 20 mwc, meaning
that the entire demand of 30 l/s in this node will be supplied; possible in the model, but
questionable in reality.
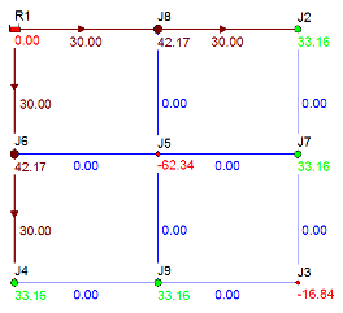
The hydraulic picture in Figure 3.10 does not appear to be affected by the highly elevated
node
J5
, compared to that shown in Figure 3.9, except for the pressure in that node. That the
flows of 16.40 l/s and 8.32 l/s can be transported via the node located 55 metres above the
source, by gravity, is of course impossible. More accurate simulation would possibly be to
simply disconnect i.e. close the pipes connected to node J5, which is shown in Figure 3.12.
Figure 3.12
PDD by Pathirana (2010), closed pipes connecting
J5
- pipes: Q (l/s), nodes: p/ρg (mwc)


Search WWH ::

Custom Search