Environmental Engineering Reference
In-Depth Information
guidelines in the Netherlands are mostly focused to the repair processes during which are the
consumers effectively disconnected. The moment of failure will hardly be felt, except a major
one, due to extra storage in the pipes.
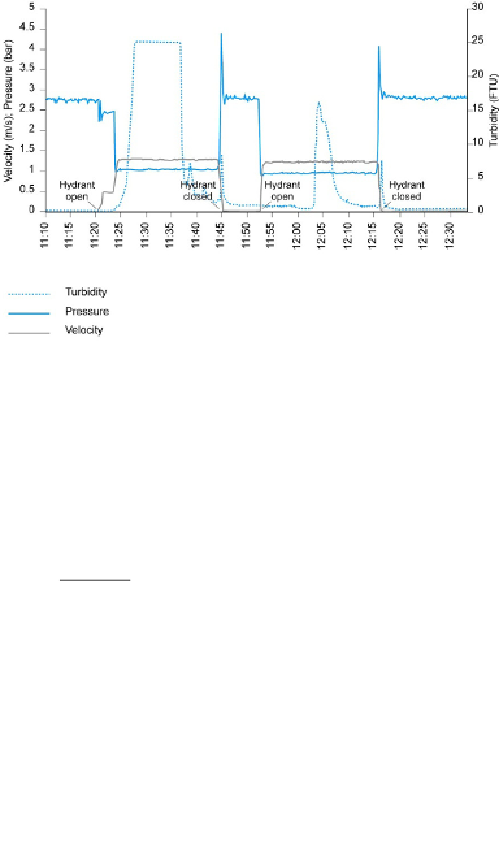
Figure 9.1
Pipe flushing diagram (Trifunović, 2006)
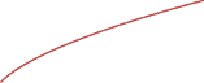
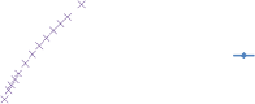
Ideal matching of recommended design values will mostly depend on the topographic
conditions that are the crucial factor for determination of supply scheme. The design
parameters will further be influenced by the pipes' condition. The form of the Darcy-
Weisbach equation shown for pipe
j
in Equation 9.1 proves this point. Figure 9.2 shows the
relation between the pipe velocities,
v
, and hydraulic gradients,
S
, for the range of diameters
between 50 and 1500 mm and four
k-
values between 0.1 and 5 mm.
2
gD
S
j
j
v
=
9.1
j
λ
j
k=0.5mm, T=10
0
C
k=0.1mm, T=10
0
C
3.00
3.00
2.50
2.50
2.00
2.00
S = 0.001
S = 0.002
S = 0.005
S = 0.01
S = 0.001
S = 0.002
S = 0.005
S = 0.01
1.50
1.50
1.00
1.00
0.50
0.50
0.00
0.00
0
500
1000
1500
0
500
1000
1500
D (mm)
D (mm)
k=1 mm, T=10
0
C
k=5 mm, T=10
0
C
3.00
3.00
2.50
2.50
2.00
2.00
S = 0.001
S = 0.002
S = 0.005
S = 0.01
S = 0.001
S = 0.002
S = 0.005
S = 0.01
1.50
1.50
1.00
1.00
0.50
0.50
0.00
0.00
0
500
1000
1500
0
500
1000
1500
D (mm)
D (mm)
Figure 9.2
Relation between pipe velocities and hydraulic gradients


Search WWH ::

Custom Search