Environmental Engineering Reference
In-Depth Information
45
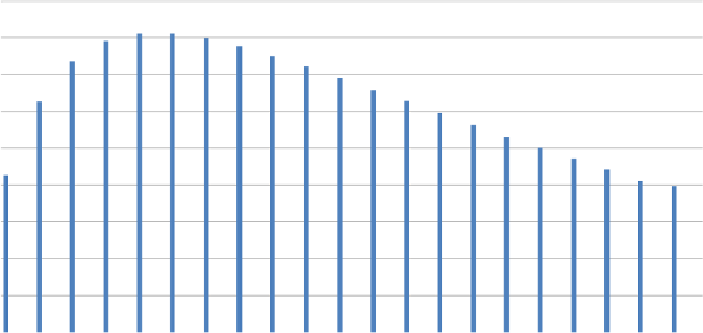
Network A Alternatives
40
35
30
25
20
15
10
5
-
1
2
3
4
5
6
7
8
9
10
11
12
13
14
15
16
17
18
19
20
21
Flat
Slope Up
Slope Down
Hill
Valley
Figure 8.7
Minimum pressure in network A based on combined change of resistance pumping capacity
45
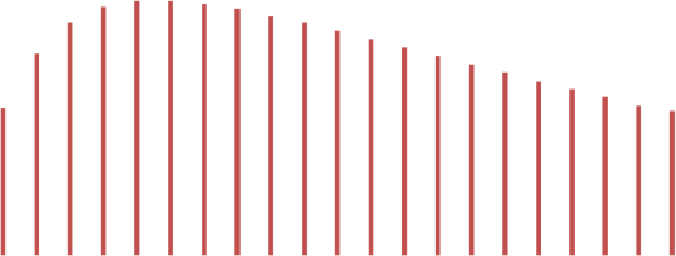
Network B Alternatives
40
35
30
25
20
15
10
5
-
1
2
3
4
5
6
7
8
9
10
11
12
13
14
15
16
17
18
19
20
21
Flat
Slope Up
Slope Down
Hill
Valley
Figure 8.8
Minimum pressure in network B based on combined change of resistance pumping capacity
The first result in both figures is from GA-optimised layout whilst all other results originate
from progressive increase of pipe diameters (up to a maximum factor of 2.65) and reduced
duty flow and duty head of the pump (up to a minimum factor for the pump speed of 0.87).
As expected, the lower minimum pressure variation in case of network options
B
results from
the available balancing tank.
All hydraulic simulations have been run both in demand driven (DD) and in pressure demand
driven mode (PDD threshold pressure = 20 mwc) for total 2520 different scenarios that are
summarised in Table 8.4. The four investment/operation scenarios deal with extreme
combinations of loan conditions and energy costs, which are shown in Table 8.5.


Search WWH ::

Custom Search