Environmental Engineering Reference
In-Depth Information
0.01 m/km, will require different diameter if the pipe length changes; this can be seen in
Table 7.14 and Figure 7.17.
Table 7.13/Figure 7.16
Correlation b
etween optimal diameter and pipe volume, L = 1000 m, S = 0.01
V (m
3
)
Q (l/s)
D (mm)
10
113
10.029
20
147
16.972
30
171
22.966
40
191
28.652
90
50
207
33.654
R² = 1
80
60
222
38.708
70
70
236
43.744
60
80
248
48.305
50
90
259
52.685
40
100
270
57.256
110
280
61.575
30
120
289
65.597
20
130
298
69.746
10
140
306
73.542
0
0
20
40
60
80
100
120
140
160
150
315
77.931
Qpipe (l/s)
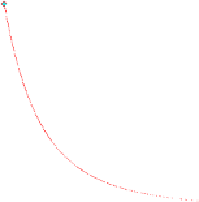
Table 7.14/Figure 7.17
Correlation between optimal diameter and pipe volume, Q = 100 l/s, h
f
= 10 mwc
L(m) S(-) D (mm) V (m
3
) v (m/s)
100 0.100
172
2.324
4.31
200 0.050
197
6.096
3.29
300 0.033
213 10.690
2.81
400 0.025
225 15.904
2.51
120
500 0.020
235 21.687
2.30
600 0.017
244 28.056
2.14
100
700 0.014
252 34.913
2.01
80
800 0.013
258 41.823
1.91
900 0.011
264 49.265
1.82
60
1000 0.010
270 57.256
1.75
1100 0.009
275 65.335
1.69
40
1200 0.008
279 73.363
1.63
20
1300 0.008
284 82.351
1.58
R² = 1
1400 0.007
288 91.202
1.53
0
1.00
1.50
2.00
2.50
3.00
3.50
4.00
4.50
5.00
1500 0.007
292 100.449
1.49
vpipe (m/s)
Hence, the pipe lengths also influence the correlation between the flows and volumes, next to
the diameters. Nevertheless, common engineering practice deals with some design principles
in which not every combination of parameters would be applied. For instance, the velocities
much above 1 m/s would be causing too high energy losses/consumption. Equally, the
hydraulic gradients much above 0.01 mean increased operational costs. Furthermore, neither
very long pipes of small diameter nor short pipes of large diameter would be common in
water distribution networks. The issue is therefore how good is the correlation between the
parameters of commonly designed pipes.


Search WWH ::

Custom Search