Environmental Engineering Reference
In-Depth Information
1
0.9
0.8
0.7
0.6
PBI73
PBI73o
NPI73
NPI73o
NRT73(hrs)
NRT73o(hrs)
0.5
0.4
0.3
0.2
0.1
0
0.9
0.91
0.92
0.93
0.94
0.95
0.96
0.97
0.98
0.99
ADFavg
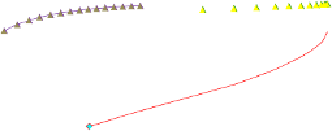
Figure 7.10
Correlation between reliability measures for sn73 and O20sn73 for D increase of 32%
1
0.9
0.8
0.7
0.6
PBI79
PBI99
NPI79
NPI99
NRT79(hrs)
NRT99(hrs)
0.5
0.4
0.3
0.2
0.1
0
0.94
0.95
0.96
0.97
0.98
0.99
1
ADFavg
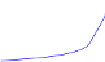
Figure 7.11
Correlation between reliability measures for sn0179 and sn0199 for D increase of 32%
1
0.9
0.8
0.7
0.6
PBI50
PBI151
NPI50
NPI151
NRT50(w)
NRT151(w)
0.5
0.4
0.3
0.2
0.1
0
0.985
0.987
0.989
0.991
0.993
0.995
0.997
0.999
ADFavg
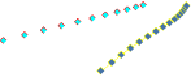
Figure 7.12
Correlation between reliability measures for ngt01-50 and ngt01-151 for D increase of 32%


Search WWH ::

Custom Search