Environmental Engineering Reference
In-Depth Information
uniformly for all the pipes and the change of the reliability measures was monitored against
the increase of the total network volume. The selection of results is shown in Figures 7.7 to
7.9.
1
1
0.9
0.9
0.8
0.8
0.7
0.7
0.6
0.6
NPI
PBI
NRT(hrs)
ADFavg
NBI
In
NPI
PBI
NRT(hrs)
ADFavg
NBI
In
0.5
0.5
0.4
0.4
0.3
0.3
0.2
0.2
0.1
0.1
0
0
2000
2200
2400
2600
2800
3000
3200
3400
3600
800
850
900
950
1000
1050
1100
1150
1200
1250
1300
Vtot (m3)
Vtot (m3)
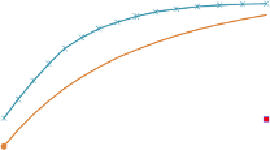
Figure 7.7
Reliability measures for networks sn73 (left) and O20sn73 (right) for D increase of 32%
1
1
0.9
0.9
0.8
0.8
0.7
0.7
0.6
0.6
NPI
PBI
NRT(hrs)
ADFavg
NBI
In
NPI
PBI
NRT(hrs)
ADFavg
NBI
In
0.5
0.5
0.4
0.4
0.3
0.3
0.2
0.2
0.1
0.1
0
0
2200
2400
2600
2800
3000
3200
3400
3600
3800
2600
2800
3000
3200
3400
3600
3800
4000
4200
4400
4600
Vtot (m3)
Vtot (m3)
Figure 7.8
Reliability measures for networks sn0179 (left) and sn0199 (right) for D increase of 32%
1
1
0.9
0.9
0.8
0.8
0.7
0.7
0.6
0.6
NPI
PBI
NRT(w)
ADFavg
NBI
In
NPI
PBI
NRT(w)
ADFavg
NBI
In
0.5
0.5
0.4
0.4
0.3
0.3
0.2
0.2
0.1
0.1
0
0
600
650
700
750
800
850
900
950
1000
1050
1100
1900
2100
2300
2500
2700
2900
3100
3300
3500
Vtot (m3)
Vtot (m3)
Figure 7.9
Reliability measures for networks ngt01-50 (left) and ngt01-151 (right) for D increase of 32%
The figures show the values of the reliability measures for enlarged network capacity that is
described by the total pipe volume. Good correlations are visible in almost all the cases and
they look specifically good between the values of
NPI
and
I
n
.


Search WWH ::

Custom Search