Environmental Engineering Reference
In-Depth Information
1.20
1.00
0.80
NGI
NCF3/3
NCFavg/3
NCI3
NSI3
ADFavg
NBI
In
0.60
0.40
0.20
0.00
1
2
3
4
5
6
7
8
9 10 11 12 13 14 15 1
2
3
4
5
6
7
8
9 10 11 12 13 14 15 1
2
3
4
5
6
7
8
9 10 11 12 13 14 15
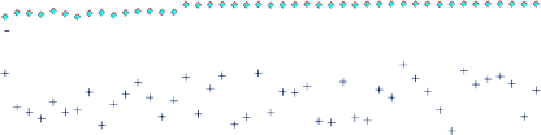
Figure 6.27
Reliability measures and connectivity indices calculated by NDT (fixed D, variable Q)
1.20
1.00
0.80
AGD/10
GD10
DEGavg/3
B
C/1000
Cc/5
ADFavg
NBI
In
0.60
0.40
0.20
0.00
1
2
3
4
5
6
7
8
9 10 11 12 13 14 15
1
2
3
4
5
6
7
8
9 10 11 12 13 14 15
1
2
3
4
5
6
7
8
9 10 11 12 13 14 15
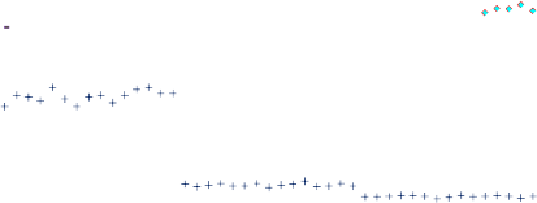
Figure 6.28
Reliability measures and connectivity indices calculated by NodeXL (fixed D, variable Q)
As can be seen on Figure 6.28, the values of
AGD
and
BC
avg
generally grow for substantial
increase in the number of pipes, while the values of
GD
and
Cc
avg
will reduce, which are the
patterns not entirely followed within the clusters. The values of
Deg
avg
fluctuate with less
prediction, slightly increasing on average, but still with the extreme values in the networks
not necessarily with the biggest number of nodes/pipes.
Table 6.21
Pearson correlation - case NGT clusters (undirected, fixed D, variable Q)
Measures NGI NCF3 NCF
avg
NCI3 NSI3 AGD GD Deg
avg
BC
avg
Cc
avg
ADFavg
0.82
0.27
0.68
0.00 0.15
0.73 -0.75 0.68 0.73 -0.77
NBI
0.56
0.28
0.54
0.08 0.17 0.48 -0.47
0.54
0.47
-0.50
In
-0.47 -0.03 -0.29 0.10 0.02 -0.32 0.48 -0.29 -0.41 0.41
Finally, the results of the Pearson correlation given in Tables 6.21 and 6.22 show relatively
weak correlations with the reliability measures, somewhat better between the
ADF
avg
and
NodeXL results and particularly weak in case of
I
n
. It shows again that making significant
correlation without taking both pipe resistance and supply heads into consideration is hardly
possible even after fixing some of these parameters for all the networks.


Search WWH ::

Custom Search