Environmental Engineering Reference
In-Depth Information
1.20
1.00
0.80
NGI
NCF3/3
NCFavg/3
N
CI3
NSI3
ADFavg
NBI
In
0.60
0.40
0.20
0.00
1
2
3
4
5
6
7
8
9
10
1
2
3
4
5
6
7
8
9
10
1
2
3
4
5
6
7
8
9
10
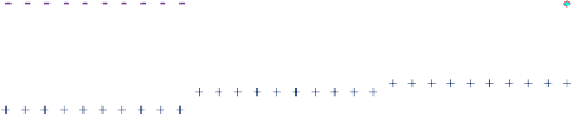
Figure 6.20
Reliability measures and connectivity indices calculated by NDT (fixed D, variable Q)
1.20
1.00
0.80
AGD/10
GD10
DEGavg/3
BC/500
Cc/5
ADFavg
NBI
In
0.60
0.40
0.20
0.00
1
2
3
4
5
6
7
8
9
10
1
2
3
4
5
6
7
8
9
10
1
2
3
4
5
6
7
8
9
10
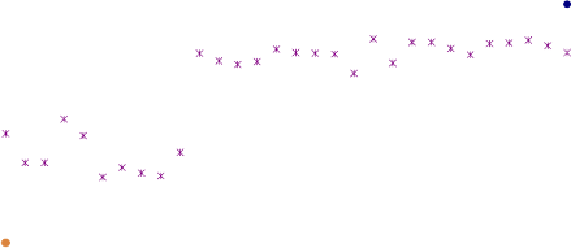
Figure 6.21
Reliability measures and connectivity indices calculated by NodeXL (fixed D, variable Q)
The hydraulic simulations have been conducted for all the networks having fixed diameter of
500 mm and variable demand multiplier, resulting in the demand range between 1949 l/s (in
network 0279) and 5858 l/s (in 0609). Other network parameters have been the same as in
the previous set of networks.
The results in Tables 6.15 to 6.18 and Figures 6.18 to 6.21 show the similar picture with
slightly better correlations. It is also becoming clearer that NodeXL measures describe the
networks' connectivity more consistently than the NDT ones. Significant improvement of
correlation shown in Table 6.17, compared to Table 6.13, is also the result of clustering of the
networks. The results split per cluster, in Table 6.18, show much weaker correlation although
it should be taken into consideration that they are based on rather short series.


Search WWH ::

Custom Search