Environmental Engineering Reference
In-Depth Information
with three and one with four connections (node N6). Although in any fairly developed
network in practice, especially in urban setup, the number of loops will overwhelm the
number of branches, describing the network shape with
NGI
value alone will not be entirely
correct approach to express the network connectivity.
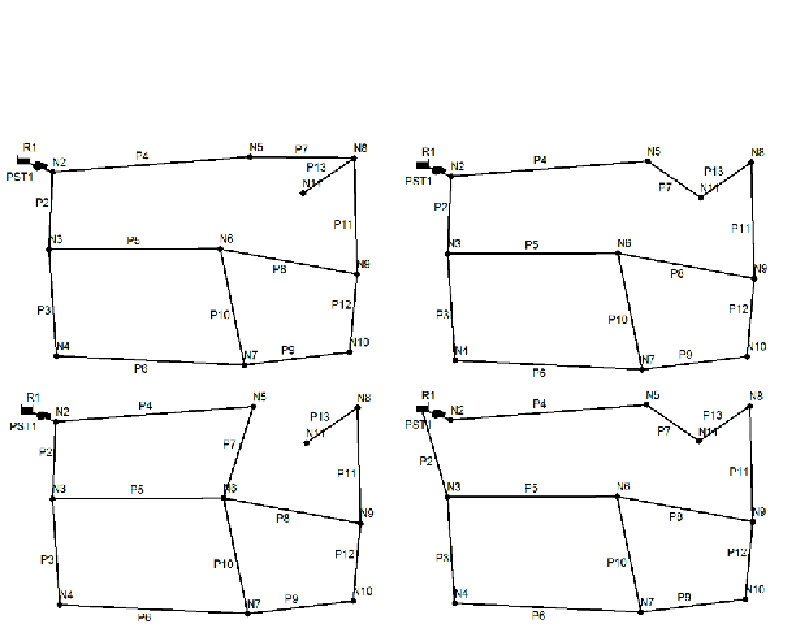
Figure 6.2
Network layouts L1 (upper-left) to L4 (bottom-right) of 13 links and 11 nodes
The following can be written for network layout of
m
links and
n
nodes:
max
con
max
con
∑
∑
in
=
2
m
;
n
=
n
6.4
i
i
i
=
1
i
=
1
where
i
is the number of connections to a node,
n
i
the number of nodes with
i
connections and
max
con
is the maximum number of connections to at least one node in the system. This
value is influenced by the network connectivity itself; for fixed values of
m
and
n
, more
nodes with lower connectivity will mean fewer nodes with higher connectivity i.e. a wider
range of nodal connectivity. In the same way, aiming at higher value of max
con
will not
increase the reliability but rather the number of lower connected nodes.
Hence, all four layouts in Figure 6.2 have three basic loops but L4 is the only fully looped
layout; L2 is also fully looped but connected to the source with single link, while L1 and L3
have one dead-end node, on top of the single connection to the source. The network
reliability will of course depend on the selection of pipe diameters, lengths and roughness
values, but purely on the pipe connectivity i.e. by keeping all other network parameters fixed,
the initial guess about the network reliability would possibly lead towards the following
ranking: L3 (the lowest reliability), L1, L2 and L4 (the highest reliability). The above
described nodal connectivity is summarised in Table 6.2.
Search WWH ::

Custom Search