Environmental Engineering Reference
In-Depth Information
2
10
1406.57
3
927.358
6
1861.21
1
1118.18
10
2
11
9
1
1353.26
1405.48
2001.48
645.828
17
5
11
20
19
929.033
887.604
1050.31
4
590.576
35
18
12
21
18
1532.94
13
1196.62
503.209
588.544
3
7
16
1252.61
22
2331.39
742.205
19
940.155
13
8
12
14
14
23
609.677
1493.16
17
36
825.552
958.395
1692.13
15
15
28
851.204
789.915
30
4
16
26
5
27
929.926
31
488.752
721.643
1639.35
8
29
25
24
1041.19
635.953
33
6
639.888
740.759
34
32
37
7
9
712.48
770.008
694.657
40
1209.62
38
20
580.778
39
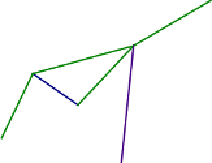
Figure 4.27
Example of non-random generated high-complex network layout of 20 junctions - L (m)
0.00
0.00
43.75
42.86
51.85
32.07
49.22
49.95
49.84
30.07
41.04
21.27
41.46
41.95
43.35
29.72
52.66
44.06
38.93
49.43
39.22
30.29
44.28
44.03
25.29
29.33
57.07
43.45
48.95
35.36
45.04
27.77
55.65
38.37
51.09
37.35
53.36
36.17
45.74
45.75
51.00
36.32
41.30
34.73
47.80
32.38
55.93
54.07
40.72
23.76
55.38
53.60
49.93
43.63
45.30
38.73
37.64
43.11
36.57
36.72
48.78
46.63
37.10
30.60
39.34
38.16
50.06
43.73
46.91
40.49
37.53
31.26
36.29
29.88
51.46
37.74
36.57
49.89
43.85
39.61
52.46
51.15
36.65
29.10
47.98
33.05
52.04
43.45
35.37
20.14
45.98
36.62
47.31
45.98
36.36
31.40
41.81
27.21
46.78
32.21
48.16
36.35
32.28
20.48
52.79
38.21
42.51
31.82
41.38
26.84
45.73
33.89
49.92
47.52
33.70
33.05
40.92
26.45
44.30
26.36
52.70
46.70
42.21
34.76
28.30
30.19
43.65
31.61
54.45
52.90
41.92
38.46
50.66
36.49
46.50
28.96
41.30
23.71
45.59
30.59
46.19
31.59
48.41
40.41
26.65
34.65
37.41
22.83
54.01
39.65
53.81
39.26
42.61
28.04
Non-optimised
Optimised
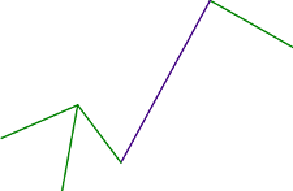
Figure 4.28
EPANET hydraulic simulation of sample network of 77 junctions (100 pipes) - p/ρg (mwc)


Search WWH ::

Custom Search