Information Technology Reference
In-Depth Information
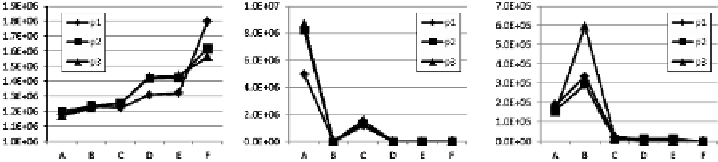
Figure 6 shows the accumulated costs for one year of simulated operation. Figure
6(a) indicates the real cost of electricity. Figures 6(b) and (c) represent the assigned
costs of availability and repulsion, respectively. As mentioned in Section 5, assigned
costs are charged when constraints are not satisfied; i.e., smaller value is preferable.
Table 2.
Configurations of weight for the applied plug-in modules
config.
electricity saving
availability
repulsion
affinity
A
1.0
-
-
-
B
1.0
2.0
-
-
C
1.0
0.5
0.5
1.0
D
1.0
1.0
1.0
1.0
E
1.0
2.0
2.0
1.0
F
-
1.0
1.0
-
(- : not applied)
Fig. 5.
Average calculation time to find an optimum VM placement
(a) electricity (b) availability (c) repulsion
Fig. 6.
Accumulated costs (duration: 1 year)
The simulation results show that the electricity cost increases as other constraints
are satisfied. In this simulation, however, both availability and repulsion were well
satisfied for configurations “D” and “E.” Compared with “F,” 8.4% to 27.3% of
electricity cost was saved.
7
Related Work
Ni et al. [8] implemented a probabilistic scheme to determine VM placement.
A roulette wheel is used in their scheme. A sector on the roulette wheel corresponds